Before buying Nike (NIKE), check whether its business is recovering in ways that can support the price you would pay—not just whether the brand is familiar. NIKE, Inc.’s fiscal 2026 revenue was $46.4 billion, flat year over year as reported and down 2% on a currency-neutral basis; net income and diluted EPS both fell 3%. Its first quarter of fiscal 2027 showed continued weakness overall and a sharp decline in Greater China. Those results make channel trends, regional demand, recurring profitability, and the assumptions embedded in the share price especially important to examine.
The figures below are company-reported. Fiscal 2026 ended May 31, 2026; Q1 FY2027 ended August 31, 2026. They are historical results, not a forecast or a buy-or-sell recommendation. A price-dependent decision also requires a fresh share quote and the latest filing.
Start with what Nike sells and how it reaches customers
NIKE, Inc. designs, develops, markets, and sells athletic footwear, apparel, equipment, accessories, and services under the NIKE, Jordan, and Converse brands. It sells through wholesale accounts, distributors, licensees, and sales representatives, as well as NIKE Direct—its owned stores and NIKE Brand Digital. Nearly all of its products are made by independent contractors, and nearly all footwear, apparel, and equipment is manufactured outside the United States.
That model makes the investment case depend on more than revenue growth. Brand demand and product innovation affect sell-through; channel mix and discounting affect margins; inventory affects the need to mark down goods; and outsourced, cross-border production creates supply-chain and trade-policy exposure. NIKE says its strategy is to pursue profitable growth through sport, product innovation, consumer connections, and retail and digital experiences. That is management’s stated plan, not evidence by itself that execution is succeeding.
What’s actually slowing this PC down?
Pick the symptom - the matching free tool is one click away.
#1 Best Overall
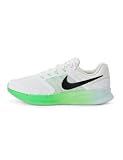
- Mesh on upper adds breathability.
- Flywire cables provide a supportive feel when you tighten the laces.
- Plush foam midsole cushions each step.
- Grooves on the rubber outsole help your foot move naturally.
- DR2695-114
Read the annual results alongside the latest quarter
Reported growth reflects results as presented, including currency movements. Currency-neutral growth removes the effect of foreign-exchange changes to help show underlying changes in sales. Compare both: the reported number describes the translated financial result, while the currency-neutral figure can make operating trends easier to assess.
| Measure | Fiscal 2026, year ended May 31 | Q1 FY2027, quarter ended August 31 |
|---|---|---|
| Total revenue | $46.4 billion; flat reported and down 2% currency-neutral year over year (NIKE, Inc., FY2026 results) | $11.2 billion; down 4% reported and 5% currency-neutral year over year (NIKE, Inc., Q1 FY2027 results) |
| NIKE Brand wholesale | $27.5 billion; up 6% reported and 4% currency-neutral year over year (NIKE, Inc., FY2026 results) | $6.8 billion; essentially flat reported and down 1% currency-neutral year over year (NIKE, Inc., Q1 FY2027 results) |
| NIKE Direct | $17.7 billion; down 6% reported and 8% currency-neutral year over year (NIKE, Inc., FY2026 results) | Down 9% currency-neutral year over year (NIKE, Inc., Q1 FY2027 results) |
| Digital and owned stores | NIKE Brand Digital down 12%; NIKE-owned store sales down 4% year over year (NIKE, Inc., FY2026 results) | NIKE Brand Digital down 13% currency-neutral and owned-store sales down 5% year over year (NIKE, Inc., Q1 FY2027 results) |
| Gross margin | 42.9%, up 20 basis points year over year (NIKE, Inc., FY2026 results) | 42.8%, up 60 basis points year over year (NIKE, Inc., Q1 FY2027 results) |
| Inventory | $7.5 billion at May 31, 2026, flat year over year (NIKE, Inc., FY2026 results) | $7.8 billion at August 31, 2026, up 5% from May 31, mainly due to product-mix shifts (NIKE, Inc., Q1 FY2027 results) |
The annual picture is mixed: wholesale grew while Direct, digital, and owned-store sales declined. In the latest quarter, wholesale was close to flat but Direct remained down. A shift in channel mix can affect how much revenue reaches the company through each route; it is worth tracking whether Direct declines stabilize and whether wholesale growth reflects durable demand and healthy sell-through, rather than merely more product moving into the channel.
Fiscal 2026 NIKE Brand revenue was $45.2 billion, up 1% reported and down 1% currency-neutral, with North America growth offset by declines in Greater China and EMEA. Converse revenue was $1.2 billion, down 31% reported and 32% currency-neutral for the year. In Q1 FY2027, footwear revenue fell 6% currency-neutral, with lower average selling price contributing about one percentage point of the decline; apparel revenue rose 2% currency-neutral. These category and brand results help explain why a stable-looking headline margin or a single growth channel is not enough to establish a broad recovery.
Rank #2

- Mesh on upper adds breathability.
- Foam midsole delivers a soft ride.
- Flex grooves create a cushioned effect for your run.
- Waffle outsole is a made of a durable, flexible material that helps keep you on the move.
- HM9594-004
Check where growth is coming from—and where it is not
Regional performance is uneven. In Q1 FY2027, North America revenue rose 2% reported and currency-neutral, while Greater China revenue fell 22% reported and 26% currency-neutral. Converse revenue fell 28% reported in the quarter. Management described declining traffic, promotional activity, and elevated marketplace inventory in Greater China, and said some China and Converse reset actions extend beyond fiscal 2027. Treat those timelines as management’s expectations, not a guarantee of when results will turn.
The Tool Desk
Outbyte PC Repair FREERepair Windows errors before they cause bigger problemsFix Now →Outbyte Driver Updater FREEScan for outdated or missing drivers - takes under a minuteDriver Scan →For subsequent reports, look for evidence that a recovery is broadening: regional sales trends, wholesale and Direct performance, digital sales, product-category demand, and the relationship between inventory and sales. A rebound in one market or channel can be encouraging, but it does not by itself resolve weakness elsewhere.
Separate recurring earnings from the Q4 tariff-recovery benefit
Fiscal 2026 net income was $3.1 billion and diluted EPS was $2.10, each down 3% year over year (NIKE, Inc., FY2026 results). Those annual figures offer a starting point for assessing earnings, but they do not make every quarter representative of the company’s ongoing earning power.
Rank #3
- Mesh on upper adds breathability.
- Foam midsole delivers a soft ride.
- Flex grooves create a cushioned effect for your run.
- Waffle outsole is a made of a durable, flexible material that helps keep you on the move.
- HM9594-004
In Q4 FY2026, gross margin was 49.2%, up 890 basis points year over year, but NIKE disclosed that the expected recovery of $986 million in IEEPA tariffs added approximately 900 basis points to the quarter’s margin. Q4 diluted EPS was $0.72, including $0.52 related to that expected tariff recovery (NIKE, Inc., FY2026 results). Do not treat either headline Q4 figure as a normal recurring run rate: much of the quarter’s year-over-year margin increase was tied to the tariff item, and the EPS figure included a substantial related benefit.
The longer comparison also cautions against assuming that recent earnings will quickly return to a prior peak. NIKE’s audited annual statements report net income of $3.1 billion in fiscal 2026, $3.2 billion in fiscal 2025, and $5.7 billion in fiscal 2024; EBIT margin was 8.3%, 8.2%, and 12.7%, respectively. Those are historical results, not evidence that the earlier margin level will return.
Recommended Free Tools
There are also signs of cost and margin pressure to examine. Q1 FY2027 gross margin improved year over year, with management attributing the improvement mainly to lower warehousing and logistics costs; the company’s detailed margin bridge also involved discounts, channel mix, foreign exchange, product costs, royalties, and Converse. Selling and administrative expense was $3.91 billion, equal to 34.9% of revenue versus 34.3% a year earlier. A margin improvement driven by lower logistics costs has a different implication from one driven by stronger pricing or product mix, so read the explanation as well as the headline percentage.
Rank #4

- Mesh on upper adds breathability.
- Foam midsole delivers a soft ride.
- Flex grooves create a cushioned effect for your run.
- Waffle outsole is a made of a durable, flexible material that helps keep you on the move.
- HM9594-001
Test the share price against explicit recovery assumptions
The financial results above do not establish a current market quote, analyst consensus, or price target. Do not infer a current P/E from the historical EPS figures alone. Before making a valuation judgment, get a timestamped share price and the latest share-count and financial information; then make clear how much improvement the price seems to require.
- Calculate a trailing P/E using current data. Divide the current share price by trailing diluted GAAP EPS from the latest available filings. State the quote timestamp and the EPS period. Fiscal 2026 diluted EPS of $2.10 is a backward-looking measure, not a current forecast or a normalized earnings figure.
- Build a separate normalized-earnings case. Explain any adjustments and why they are appropriate. Do not carry the Q4 FY2026 expected tariff-recovery contribution into recurring earnings. Use a range of plausible sales and margin outcomes rather than assuming a quick return to fiscal 2024 profitability.
- Cross-check the equity valuation. Estimate market capitalization using the share price and a current share count, then account for cash, debt, and other relevant balance-sheet items when calculating enterprise value. Compare enterprise value with operating earnings and cash flow, using consistent periods and clearly identified adjustments.
- Write down what the price assumes. Set out downside, base, and upside cases for revenue growth, gross margin, operating expenses, and regional recovery. Ask whether the valuation still makes sense if Direct remains weak, Greater China takes longer to improve, or markdowns limit margin gains.
NIKE reported $9.0 billion of cash and equivalents plus short-term investments at May 31, 2026. Use the latest balance sheet rather than assuming that this annual figure is still current. A valuation multiple is meaningful only when its earnings or cash-flow denominator is defined, comparable, and not inflated by an unusual benefit.
Independent reader supportYour contribution helps us test, update, and keep practical guides available for everyone.Track inventory and discounting as a connected signal
Inventory increased from $7.5 billion at May 31 to $7.8 billion at August 31, 2026. NIKE attributed the quarter-end increase mainly to product-mix shifts. A sequential increase across these dates is not, on its own, proof that inventory is excessive; assess it together with unit levels, inventory age, sell-through, and markdowns in subsequent filings.
Windows Errors? Fix Them Before They Spread
Repair common Windows errors and clear accumulated junk for a smoother, more stable PC - no reinstall needed.Free scan · no reinstallCrashes, No Sound, or Screen Glitches?
Random freezes, missing sound and display glitches usually trace back to one bad driver. Find and replace yours safely.Free scan · under a minuteBest Value

- The mesh upper offers a comfortable, breathable feel.
- The foam midsole delivers intuitive cushioning through comfort-focused rocker geometry.
- The outsole has an intuitive Nike design and flex grooves in the forefoot that create a comfortable and cushioned effect as you run.
- Touch points at the heel and tongue create a natural feel as you take the shoes on and off.
- HJ9198-002
NIKE has described marketplace actions that include markdowns and wholesale discounts or returns to reduce inventory and make room for new products. Those actions can help move goods, but lower prices can also reduce average selling prices and weigh on gross margin. Check whether sales improve alongside inventory and whether margin holds up without unusual benefits. A fall in inventory achieved mainly through discounting is different from a fall supported by stronger full-price demand.
Weigh the main risks against evidence of progress
- Demand, fashion, and innovation: consumer preferences can change faster than product lead times. If products fail to connect with customers, sales can weaken and inventory may require markdowns.
- Brand and reputation: product quality, innovation, marketing, consumer perception, and supplier conduct all affect the brand. NIKE notes that supplier violations or allegations can cause reputational harm even though the company does not control suppliers’ practices.
- Trade, currency, and supply chain: NIKE identifies tariff policy, foreign exchange, geopolitical conditions, and tax regulation as uncertainties that could adversely affect results. Reliance on independent contractors and production largely outside the United States adds cross-border sourcing and execution dependencies.
- Competition and channel execution: the business depends on consumer connections, successful product launches, wholesale relationships, owned stores, and digital platforms. Weak sell-through or execution can affect both channels and profitability.
Against those risks, fiscal 2026 gross margin was 42.9%, up 20 basis points, wholesale revenue grew, North America provided an area of growth, and Q1 FY2027 benefited from lower warehousing and logistics costs. These are relevant signs to test, not proof that a durable turnaround is underway. The counterweights in the reported results are declining Direct and digital sales, severe Greater China weakness, falling Converse revenue, and continued marketplace actions involving discounts.
Quick Recap
Use a filing-by-filing checklist
- Compare reported and currency-neutral revenue growth, and keep fiscal-year and quarterly comparisons separate.
- Check whether wholesale, NIKE Direct, digital, and owned-store trends are improving together or diverging.
- Review North America, Greater China, EMEA, and Converse results for the breadth and pace of recovery.
- Read the gross-margin bridge for the role of logistics, discounts, channel mix, product costs, foreign exchange, and any unusual benefits.
- Compare inventory with sales, units, product mix, inventory age, markdowns, and sell-through.
- Recalculate valuation with a current share quote and current financial statements, and test downside, base, and upside assumptions.
Product prices and availability are accurate as of the date/time indicated and are subject to change. Any price and availability information displayed on Amazon at the time of purchase will apply.




