Crashes, No Sound, or Screen Glitches?
Random freezes, missing sound and display glitches usually trace back to one bad driver. Find and replace yours safely.Free scan · under a minuteWindows Errors? Fix Them Before They Spread
Repair common Windows errors and clear accumulated junk for a smoother, more stable PC - no reinstall needed.Free scan · no reinstallRisk management is the structured process of understanding how uncertainty could affect your objectives, deciding which risks matter most, choosing proportionate responses, and checking whether those responses work.
For a household, investor, business, or project, it means more than avoiding danger. It means identifying what could go wrong—or unexpectedly right—estimating the consequences, and deciding what to do with limited money, time, and attention.
| # | Preview | Product | Price | |
|---|---|---|---|---|
| 1 |

|
Fundamentals of Risk Management: Understanding, Evaluating and Implementing Effective Enterprise... | $41.66 | Buy on Amazon |
| 2 |
|
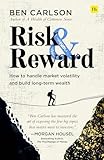
Risk and Reward | $15.54 | Buy on Amazon |
| 3 |
|
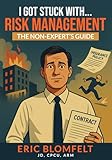
I Got Stuck with Risk Management - the Non-Expert's Guide | $19.95 | Buy on Amazon |
| 4 |

|
Against the Gods: The Remarkable Story of Risk | $14.71 | Buy on Amazon |
| 5 |

|
Risk: A User's Guide | $23.96 | Buy on Amazon |
Risk management in plain English
An ISO-aligned definition describes risk as the effect of uncertainty on objectives. The objective might be retiring comfortably, keeping a business solvent, delivering a project on time, protecting customer data, or meeting a safety requirement. ISO 31000 presents risk management as a way to create and protect value, integrate risk thinking into decisions, involve stakeholders, and improve continuously (ISO 31000).
A useful risk statement connects three elements:
- Cause: the condition creating exposure;
- Uncertain event or change: what might happen;
- Effect: how the event could affect an objective.
For example: Because a business depends on one supplier, a regional outage could delay production for several weeks and reduce quarterly revenue.
Recommended Free Tools
#1 Best Overall
Risk management does not promise that bad outcomes can be eliminated. Its purpose is to make decisions more deliberate: which risks should be avoided, reduced, transferred, accepted, or pursued for potential benefit?
Risk versus uncertainty, issues, hazards, and problems
| Term | Meaning | Example |
|---|---|---|
| Risk | An uncertain effect on an objective whose likelihood and consequences can be considered. | A customer may fail to pay an invoice. |
| Uncertainty | What is unknown about outcomes, probabilities, relationships, or timing. | You have little data about how often a new type of outage occurs. |
| Ambiguity | Different people interpret the situation or its consequences differently. | Teams disagree about what “acceptable service” means. |
| Ignorance | Important possibilities have not yet been identified. | A dependency is missing from the risk review entirely. |
| Issue or problem | An event that has already happened and now requires management. | The supplier has already missed the delivery date. |
| Hazard | A source of potential harm. | An exposed electrical component. |
Not all uncertainty can be converted into a reliable probability. For deeply uncertain situations, scenario analysis, stress testing, resilience, and adaptive monitoring may be more useful than a precise-looking percentage. Quantification can make assumptions visible; it cannot make weak assumptions correct.
Why organizations and households manage risk
Risk management helps decision-makers:
- Protect people, savings, assets, operations, and reputation.
- Allocate limited money and attention to the exposures that matter most.
- Compare insurance, safeguards, investments, and contingency plans.
- Prepare for disruption and recover more quickly.
- Meet legal, contractual, regulatory, or governance expectations.
- Pursue growth without ignoring the downside.
In personal finance, examples include maintaining an emergency fund, diversifying investments, insuring major risks, limiting unaffordable debt, and planning for income interruption. In an organization, the same logic applies across strategy, finance, operations, technology, suppliers, compliance, and safety.
The risk-management process
1. Establish objectives and context
“High risk” has no stable meaning without context. Define the objective, time horizon, stakeholders, constraints, and decision-maker. A household might prioritize avoiding a forced sale of its home; a company might prioritize uninterrupted payroll; a project might prioritize delivery by a contractual date.
Do these 3 things before closing this tab:
1Scan for outdated or missing drivers - takes under a minute2Clear out junk files and repair common Windows errors3Fix the driver behind crashes, sound loss and screen glitchesAlso define risk appetite, tolerance, and capacity:
- Risk appetite: the broad amount and type of risk an organization is willing to pursue or retain.
- Risk tolerance: the acceptable variation around an objective.
- Risk capacity: the maximum exposure that can be withstood before solvency, safety, legal obligations, or survival are threatened.
- Threshold or trigger: a measurable point requiring escalation or action.
There is no universal acceptable risk level. A company may accept substantial market risk but have very low tolerance for payroll failure or unlawful conduct.
2. Identify risks
Useful techniques include process mapping, interviews, historical incidents, near-miss reviews, supplier analysis, dependency mapping, failure-mode analysis, threat modeling, scenario planning, and external-indicator monitoring.
Each identified risk should state the objective affected, cause, possible event, consequence, owner, and rationale or evidence. Categories help discovery but should not become rigid silos. A cloud outage, for example, may simultaneously be an operational, cybersecurity, third-party, financial, compliance, and reputational risk.
What’s actually slowing this PC down?
Pick the symptom - the matching free tool is one click away.
Rank #2
3. Analyze likelihood and consequences
Consider more than a single likelihood and impact score:
- How likely is the event, and over what time period?
- How large could the consequence be?
- How long would the effect last?
- How quickly would the organization receive warning?
- How effective are existing controls?
- Could several risks occur together?
- How confident are you in the estimates?
4. Evaluate and prioritize
Compare the analyzed exposure with risk appetite, legal or safety thresholds, service commitments, strategic priorities, available capital, and stakeholder expectations. A risk matrix can help triage a long list, but its colors and scores are usually ordinal rankings—not measured probabilities.
5. Treat the risk
A treatment plan should name the action, owner, resources, due date, expected effect, verification method, contingency plan, and residual risk. “Residual risk” is the exposure remaining after controls; “inherent risk” is the exposure before those controls.
6. Monitor and communicate
Risk management is not a one-time register exercise. Track key risk indicators, trigger thresholds, control tests, near misses, changing assumptions, action completion, new dependencies, and risk velocity—the speed at which exposure can worsen. NIST’s Risk Management Framework makes monitoring an explicit continuing activity, alongside preparing, categorizing, selecting, implementing, assessing, and authorizing controls (NIST RMF).
How to quantify risk
Qualitative analysis
Qualitative analysis uses labels such as rare, possible, likely, minor, severe, or low/medium/high. It is often appropriate when data is sparse, a decision is early-stage, consequences are difficult to monetize, or detailed analysis would cost more than it is worth.
Its limitations matter. Different people may interpret “high” differently, and a low-probability catastrophic event can deserve attention even if a matrix places it below a frequent minor loss.
Semi-quantitative scoring
Numerical scales and weighted scores can improve consistency, but they may still be rankings rather than measured probabilities. Document what each score means, the time horizon, whether it represents inherent or residual risk, how controls affect it, and who approved the calibration. Multiplying arbitrary scores does not create scientific precision.
Expected loss
A simplified screening model is:
Expected loss = probability of event × consequence if it occurs
Free tools Windows power users keep installed
One-click scans. No signup required.
If a disruption has an estimated 10% annual probability and would cost $500,000, its simplified annual expected loss is $50,000. The time horizon and assumptions must be stated: this is not a complete forecast of the actual loss.
For several mutually exclusive outcomes:
Expected value = Σ probability of outcome × value of outcome
For repeated losses, an approximate annualized measure is annual frequency multiplied by average loss per event. This can mislead when losses are highly skewed, events are correlated, or the estimate ignores recovery, legal, safety, and reputational effects.
Ranges, scenarios, and sensitivity analysis
Use ranges instead of single-point estimates when inputs are uncertain. Sensitivity analysis changes assumptions to reveal which ones drive the result. Scenario analysis examines coherent futures—for example, a base case, a severe-but-plausible case, a best case, and a compound disruption.
These methods are especially valuable when historical data is a poor guide to future conditions.
Monte Carlo simulation
Monte Carlo simulation repeatedly samples uncertain inputs from specified distributions and produces a distribution of possible outcomes. It can show a median or expected result, percentiles, the probability of exceeding a threshold, and the assumptions that matter most.
It does not produce certainty. Output quality depends on the model, input distributions, correlations, and control-effectiveness assumptions. NIST describes a progression from baseline estimates to sensitivity analysis and Monte Carlo simulation in its economic evaluation guidance (NIST guidance).
Worked example: a supplier disruption
Suppose a business depends on a single supplier. Management estimates three possible annual outcomes:
Rank #4
| Outcome | Probability | Estimated cost | Expected loss |
|---|---|---|---|
| Short delay | 30% | $100,000 | $30,000 |
| Major delay | 10% | $400,000 | $40,000 |
| Supplier failure | 5% | $1,000,000 | $50,000 |
| Simplified total expected loss | $120,000 | ||
The arithmetic suggests that a $70,000 mitigation could be attractive if it reduces expected exposure by more than $70,000. But that is only a starting point. Decision-makers should ask whether the probabilities are credible, whether outcomes can happen together, whether the severe loss threatens survival, whether the control creates new vendor or operational dependencies, and whether the estimates cover recovery and reputational costs.
Candidate treatments might include a second supplier, safety stock, contractual service levels, business-interruption insurance, substitute materials, and a tested recovery plan. The decision should compare cost, residual exposure, implementation time, reliability, reversibility, and the risk created by each treatment—not simply choose the option with the lowest probability.
A monitoring plan could set triggers for supplier financial deterioration, missed milestones, regional disruption, or inventory falling below a defined number of production days.
Risk responses
Avoid
Change the plan so the exposure is removed. Examples include not entering a market, stopping a dangerous process, or eliminating a single point of failure. Avoidance can also eliminate valuable opportunities.
Reduce
Lower the probability, consequence, duration, or detectability of the event through redundancy, maintenance, testing, training, access controls, backups, diversified suppliers, phased releases, or safety barriers.
Transfer or share
Shift some financial or operational consequences through insurance, contracts, warranties, outsourcing, hedging, or service-level agreements. Transfer does not eliminate the underlying risk: exclusions, limits, counterparty failure, delays, and reputational effects may remain.
Accept or retain
Consciously retain exposure when it is within tolerance or treatment costs more than the benefit. Acceptance should be explicit, owned, and time-bounded when appropriate. Doing nothing is not automatically an informed acceptance decision.
Exploit or enhance opportunities
Risk can create upside as well as downside. An organization can exploit an opportunity by allocating resources to make it happen, enhance it by increasing its probability or benefit, share it with a partner, or accept it without special action.
Best Value
Prepare and recover
Some events cannot be prevented economically. Business continuity, incident response, crisis communications, disaster recovery, emergency savings, and recovery funding reduce consequences after the event occurs. NIST’s guidance distinguishes engineering, managerial, and financial mitigation strategies and recommends comparing combinations of strategies (NIST economic evaluation guidance).
Independent reader supportYour contribution helps us test, update, and keep practical guides available for everyone.Frameworks: ISO 31000, COSO ERM, and NIST RMF
- ISO 31000: A broad, principles-based guideline for organizational risk management. It is not presented here as a conformity-certification standard. The current listed edition is ISO 31000:2018, reviewed and confirmed in 2023 (ISO).
- COSO ERM: Enterprise risk management guidance connecting risk with strategy and performance. COSO updated its ERM framework in 2017 (COSO). Whether it is required depends on jurisdiction, industry, regulator, exchange, contract, or internal policy.
- NIST RMF: A life-cycle approach for security, privacy, and cyber supply-chain risk, particularly relevant to U.S. federal agencies and contractors. Its particular requirements and terminology may not apply to every organization (NIST).
Building a practical risk register
A spreadsheet is often sufficient for a small, stable risk portfolio. Useful fields include:
| Field | Purpose |
|---|---|
| Risk ID and objective | Provides a stable reference and explains why the risk matters. |
| Category, cause, event, consequence | Creates a clear, testable risk statement. |
| Inherent likelihood and impact | Shows exposure before controls. |
| Existing controls and effectiveness | Records safeguards and evidence that they work. |
| Residual likelihood and impact | Shows remaining exposure after controls. |
| Assumptions and confidence | Makes weak evidence and uncertainty visible. |
| Owner, treatment, resources, due date | Turns analysis into accountability. |
| Trigger or key risk indicator | Shows when action or escalation is required. |
| Contingency and review date | Supports response and prevents stale records. |
Enterprise software becomes more defensible when teams need workflow, approvals, audit trails, control testing, regulatory reporting, third-party risk management, role-based access, portfolio aggregation, or automated alerts. It is a poor fit if it adds administrative overhead, encourages meaningless scores, cannot represent dependencies, or is purchased before objectives, ownership, appetite, and treatment processes are agreed.
Common risk-management failures
- False precision: A probability such as 17.3% may be expert intuition presented as measurement. Show ranges, evidence, assumptions, and confidence.
- Stale registers: Scores never change, near misses are excluded, and review dates are ignored.
- Risk-register theater: Owners are nominal, actions lack resources, and treatment success is never tested.
- Ignoring correlation: A regional outage may affect several suppliers, facilities, and customers simultaneously.
- Hiding tail risk: Average expected loss can conceal a rare outcome that threatens liquidity or survival. Report severe scenarios, percentiles, and recovery constraints.
- Confusing compliance with safety: Passing an audit does not prove that risk is acceptable.
- Controls that create new risks: Automation may introduce vendor dependency, privacy exposure, configuration errors, false alarms, or a new single point of failure.
- Poor incentives: People may suppress risks to protect bonuses or avoid blame. Encourage escalation and distinguish a bad outcome from a bad decision made with reasonable information.
- Opportunity blindness: Excessive controls can reject worthwhile investments and slow useful experimentation.
When is quantitative analysis worth the effort?
Quantify more deeply when the decision involves a large consequence, expensive or irreversible commitment, major capital allocation, regulatory or safety exposure, competing mitigation options, or a meaningful chance of exceeding a defined threshold. It is especially useful when better information could change the decision.
The Tool Desk
Outbyte Driver Updater FREEScan for outdated or missing drivers - takes under a minuteDriver Scan →Outbyte PC Repair FREERepair Windows errors before they cause bigger problemsFix Now →Use a lighter approach when consequences are small, the decision is easily reversible, data quality is poor, or the cost of analysis exceeds the value of improved precision. Even then, document assumptions, use scenarios where appropriate, and identify warning indicators.
The right question is not “Can we calculate a number?” It is “Will a better representation of uncertainty improve this decision?”
Final takeaway
Risk management is disciplined decision-making under uncertainty. Start with objectives, describe causes and consequences, assess likelihood and impact honestly, distinguish rankings from probabilities, choose proportionate treatment, assign an owner, and monitor what changes. The goal is not to eliminate every uncertainty; it is to understand which uncertainties matter, remain resilient when estimates are wrong, and preserve worthwhile opportunities while keeping unacceptable exposure within bounds.
Quick Recap
Product prices and availability are accurate as of the date/time indicated and are subject to change. Any price and availability information displayed on Amazon at the time of purchase will apply.
Quick wins for a faster PC:
Clear out junk files and repair common Windows errorsFree Scan →Scan for outdated or missing drivers - takes under a minuteDriver Scan →



