The United States, Brazil and Argentina are major corn and soybean producers, but their relative scale changes by crop: USDA Foreign Agricultural Service (FAS) estimates for 2025/26 put the United States first in corn, while Brazil leads soybeans. U.S. acreage estimates and Brazil’s national crop survey add useful context, but acreage, production estimates and forecasts measure different things and should not be combined into a single ranking.
How corn and soybean production compares
USDA FAS’s 2025/26 marketing-year tables provide a common cross-country reference for the three largest producers covered here. The figures below are FAS estimates of total production in million metric tonnes; they are not acreage or yield figures.
| Crop | United States | Brazil | Argentina |
|---|---|---|---|
| Corn | 432.34 million tonnes | 141 million tonnes | 63 million tonnes |
| Soybeans | 115.99 million tonnes | 180.5 million tonnes | 49.5 million tonnes |
In this FAS comparison, U.S. corn output is substantially larger than Brazil’s or Argentina’s. Soybeans show the reverse pattern at the top: Brazil’s estimated output exceeds the U.S. figure, with Argentina also a significant producer. These are crop-specific comparisons, not a general measure of which country has the most productive agriculture.
What Brazil’s national survey adds
Brazil’s National Supply Company, CONAB, estimated 2025/26 total grain production at 361.7 million tonnes in its 12th survey. Within that total, CONAB put soybeans at 180.4 million tonnes and the country’s three corn crops combined at 144 million tonnes. CONAB described the soybean result as a record, attributing it to higher planted area and average yield; its corn figure covers multiple crop seasons.
The Tool Desk
Outbyte Driver Updater FREEScan for outdated or missing drivers - takes under a minuteDriver Scan →Outbyte PC Repair FREERepair Windows errors before they cause bigger problemsFix Now →#1 Best Overall
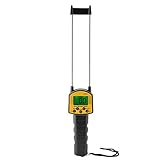
- MEASURING RANGE: 7.5-44% (Rapeseed, Sesame, Soymeal, Seed Cotton), 10-50% (Soybean, Peanut), 11-50% (Barley, Rice, Sorghum, Watermelon Seed), 11-55% (Paddy, Wheat), 11.5-50% (Corn, Feed).
- DISPLAY: LCD backlight display, convenient to read measuring data at darkness.
- LOW BATTERY INDICATION: Yes. High rod steel probe, Ergonomically design non-slip handle fits the palm well.
- MAIN FUNTION: This meter can quickly measure the water content of 14 varieties of such as wheat corn rice peanut soybean and more.
- SETTING MEMORY FUNCTION: Yes. Designed with a speaker on the back of the meter, which can report the measuring reading.
CONAB’s Brazilian estimates are close to, but not identical with, the USDA FAS figures in the comparison table. For soybeans, the estimates are 180.4 million tonnes from CONAB and 180.5 million from FAS; for corn, they are 144 million and 141 million, respectively. These are separate agencies’ estimates, not values to average together. Brazil’s multiple corn harvests and differences in source scope or estimation can matter when comparing figures. Keep each number attached to its agency and do not treat a difference as proof of a final harvest outcome.
What the latest U.S. acreage says—and does not say
USDA’s National Agricultural Statistics Service (NASS) estimated 2026 U.S. planted area at 95.3 million acres for corn, down 3% from 2025, and 85.4 million acres for soybeans, up 5%. These June 30, 2026 acreage estimates describe land planted, not harvested output, yield, or stocks. A change in acres alone cannot establish whether production will rise or fall.
Rank #2

- [High Precision Automatic Counter] Automaticly count kinds of grain by setting number, when it reaches to the setting number the instrument stop work.
- [Adjustable Counting Speed] Can adjust by the Speed Knob. Turn the knob clockwise, the grain particles go faster. Max counting speed reach1000pcs/3min.
- [Microcomputer Automatic Control] This seeds counter control by the microcomputer chip, matches by membrane pressed key operation.
- [Wide Application] This instrument is wildly used in institute of Agricultural Sciences, the Agriculture Universities, Colleges and Institutes, the Grain Department.
- NOTE: ?This machine can't count irregular shape particles. The Max size like corn, Min size like Wheat. Please contact us and tell us which items you plan to count with this machine, so that we can confirm whether it?s suitable for you!!!!!
NASS also estimated all-wheat planted area at 42.7 million acres in 2026. That is a U.S. area statistic, not a wheat-production total, and it cannot be compared directly with the corn and soybean production figures above.
Wheat and the limits of a three-country comparison
The figures cited here do not establish a comparable 2025/26 wheat-production ranking for the United States, Brazil and Argentina. The available U.S. wheat figure is planted area, while USDA FAS’s July 2026 Argentina update says higher wheat output is expected with a larger planted area but does not give a wheat production total in the figures presented here. Area, a directional outlook and total harvested production are different measures; they should not be used to infer a ranking.
What’s actually slowing this PC down?
Pick the symptom - the matching free tool is one click away.
Rank #3

- PRODUCT FEATURE: The corn humidity meter has LCD backlight display that ensures clear visibility of readings, making it suitable for use in both dark conditions and direct sunlight. Features a built-in speaker that provides real-time voice reporting of measured values
- MEASURING RANGE: This humidity detector has a wide measuring range, 7.5-44% (Rapeseed, Sesame, Soymeal, Seed Cotton), 10-50% (Soybean, Peanut), 11-50% (Barley, Rice, Sorghum, Watermelon Seed), 11-55% (Paddy, Wheat), 11.5-50% (Corn, Feed)
- EXCELLENT DESIGN: Constructed with a quality steel probe, this humidity tester offers durable performance resistance to wear. The ABS protective sleeve ensures safe operation, while the ergonomic slip proof handle fits the palm well
- PACKAGING INFORMATION: Ships with one model AR991 corn humidity meter and one manual, with batteries not included. This device is designed for agricultural use, to support farming needs effectively
- APPLICABLE OBJECTS: This humidity tester probe can quickly measure the water content of 14 varieties of items such as wheat corn rice peanut soybean and more. Easy handling for agricultural humidity assessments
This comparison focuses on the United States, Brazil and Argentina, where the cited sources provide useful current figures. It is not an exhaustive account of every South American country or crop, and it does not support a region-wide ranking.
Separate estimates from forecasts and projections
USDA FAS’s July 2026 Argentina update forecasts 60.5 million tonnes of corn for marketing year 2026/27. That is a forecast for a future marketing year, not a completed-harvest result and not the same figure as FAS’s 63 million-tonne 2025/26 Argentina estimate. The two figures describe different marketing years and statuses, so they should not be read as a confirmed year-over-year change.
Rank #4

- Your hunt is in the bag - we deliver more quality seed for your money!
- Certified seed for maximum growth and attractant
- 1 bag (5 lbs) plants approximately 1/10 acre
- High protein and highly preferred forage for deer
- Non-GMO - ideal for mixing with other food plot seeds
USDA’s May 12, 2026 World Agricultural Supply and Demand Estimates (WASDE-671) cautioned: “Due to spring planting still underway in the Northern Hemisphere, and several months away in the Southern Hemisphere, the forecasts are highly tentative.” This matters because the U.S. and South American crop calendars do not line up, and early forecasts can change as planting and growing seasons progress.
A different kind of forward-looking number comes from USDA’s Economic Research Service (ERS). Its 2026 long-term baseline projects planted area across eight major U.S. field crops to decline from 247.6 million acres in 2026/27 to 241.6 million acres in 2035/36, a 2.4% decrease. Within that baseline, ERS projects 2026/27 planted area of 95.0 million acres for corn, 85.0 million for soybeans and 44.0 million for wheat. These are projections, not NASS survey results or production forecasts. They also use a different year and purpose from the NASS 2026 acreage estimates.
Quick wins for a faster PC:
Repair Windows errors before they cause bigger problemsFix Now →Scan for outdated or missing drivers - takes under a minuteDriver Scan →Clear out junk files and repair common Windows errorsFree Scan →Best Value
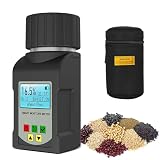
- 【SUPPORT 25 GRAINS】: The grain moisture tester is specifically designed to measure the moisture content of 25 different grains, including soya beans, voffee, lentils, grass seed rye grass, and more. Get accurate measurement results to help you make better agricultural practice decisions.
- 【PRECISE MEASUREMENT】: The smart grain moisture meter has a built-in high-precision sensor. Achieve accurate grain moisture readings with an industry-leading accuracy of ±0.5%, even under diverse environmental conditions. Ensure every measurement is reliable, demonstrating excellent reliability and accuracy, giving you full confidence in the quality of your grains.
- 【AUTOMATIC TEMPERATURE COMPENSATION】: This moisture meter for seeds comes equipped with automatic temperature compensation, which ensures consistent and accurate measurements regardless of changes in ambient temperature, making it ideal for indoor and outdoor use.
- 【BACKLIT DIGITAL DISPLAY】: Using backlight liquid crystal display technology, clear display and low power consumption, fast measurement speed, showing clear content in different lights. Whether for field or lab use, this moisture tester offers simplicity and efficiency, streamlining moisture measurement processes.
- 【VOICE BROADCAST】During measurement, it precisely announces the moisture value, enabling you to get key data without staring at the screen. If the lid isn't closed securely, the voice function gives a prompt, averting measurement errors from lid problems
How to read crop-production comparisons
- Check the measure. Planted area is land seeded; harvested area is land harvested; yield is output per unit of land; production is total output; stocks are inventories. One cannot stand in for another.
- Check the crop year or marketing year. A 2025/26 estimate, a 2026/27 forecast and a 2035/36 projection are not observations from the same period.
- Keep the source attached. USDA FAS supports a common cross-country frame, while NASS and CONAB provide national survey context. If agencies differ, report their figures separately rather than silently averaging.
- Use the comparison that answers the question. Production compares total scale; yield compares output per area; planted area compares land use; forecasts and projections describe expected or modeled futures.
For current output scale, the FAS 2025/26 figures show U.S. leadership in corn and Brazilian leadership in soybeans among these three countries. For U.S. planting decisions, NASS acreage is the relevant measure, while CONAB’s survey gives a Brazil-specific estimate that includes the country’s multiple corn crops. Those are complementary views, not interchangeable statistics.
Quick Recap
Product prices and availability are accurate as of the date/time indicated and are subject to change. Any price and availability information displayed on Amazon at the time of purchase will apply.




