Quick wins for a faster PC:
Clear out junk files and repair common Windows errorsFree Scan →Fix the driver behind crashes, sound loss and screen glitchesFind Drivers →Sony’s Game & Network Services (G&NS) segment recorded ¥1.6823 trillion in sales in the three months ended December 31, 2024, up ¥237.9 billion, or 16%, year over year. PS5 hardware volume, third-party software and add-on content, and network services all contributed. But first-party game sales fell, making this a story about the strength of PlayStation’s broader platform—not a burst of Sony-developed hits. Sony’s February 13, 2025 results are historical; later results show that the sales growth did not simply continue.
What Sony’s 16% growth measures
The 16% figure refers to sales for Sony’s entire Game & Network Services segment, not PS5 hardware revenue or profit. In fiscal Q3 2024, the quarter ended December 31, 2024, G&NS sales rose from ¥1.4444 trillion a year earlier to ¥1.6823 trillion. The increase was ¥237.9 billion. Sony’s reported comparison is in yen; it should not be confused with a constant-currency growth rate. Sony’s Q3 FY2024 presentation sets out the segment results and management’s explanation.
As an Amazon Associate I earn from qualifying purchases.
Revenue, unit volume, profit and platform engagement are related but distinct measures. In this quarter, all pointed to a strong holiday period, though not every indicator moved in the same direction.
The Tool Desk
Outbyte PC Repair FREERepair Windows errors before they cause bigger problemsFix Now →Outbyte Driver Updater FREEScan for outdated or missing drivers - takes under a minuteDriver Scan →The holiday-quarter numbers
| Measure | FY2023 Q3 | FY2024 Q3 | Year-over-year change |
|---|---|---|---|
| G&NS sales | ¥1.4444 trillion | ¥1.6823 trillion | +¥237.9 billion; +16% |
| G&NS operating income | ¥86.1 billion | ¥118.1 billion | +37% |
| PS5 hardware units | 8.2 million | 9.5 million | +1.3 million |
| PS4 and PS5 full-game software | 89.7 million copies | 95.9 million copies | +6.2 million |
| First-party software | 16.2 million copies | 11.6 million copies | −4.6 million |
| Network-services sales | ¥176.915 billion | ¥199.276 billion | +¥22.361 billion |
Sony reported the hardware, full-game and first-party software figures in its supplemental operating data; its presentation reported segment sales and operating income. The PS5 figure is Sony’s reported quarterly unit figure, not a separately established measure of consumer sell-through. Sony put cumulative PS5 shipments at approximately 75 million by the quarter’s end.
#1 Best Overall

- Model Number CFI-2000
- Includes DualSense Wireless Controller, 1TB SSD, 2 Horizontal Stand Feet, HDMI Cable, AC power cord, USB cable, printed materials, ASTRO’s PLAYROOM (Pre-installed game)
- Vertical Stand sold seperately
Why sales increased
More PS5 hardware volume
Sony reported 9.5 million PS5 units for the quarter, compared with 8.2 million in the year-earlier holiday period. Higher hardware unit sales helped lift segment sales, although the segment total also includes software and services. Sony also said hardware profitability improved and hardware losses were lower; it did not say that hardware had become a standalone profit engine.
Third-party games and add-on content
Sony cited increased sales of non-first-party software and add-on content. That points to a platform effect: PlayStation earned revenue from activity across its game ecosystem, not only from titles Sony publishes itself. The higher total full-game software volume alongside fewer first-party copies sold reinforces that distinction.
Rank #2
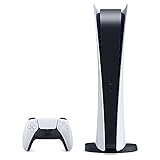
- CPU: x86-64-AMD Ryzen Zen 8 Cores / 16 Threads at 3.5GHz.GPU: AMD Radeon RDNA 2-based graphics engine.
- 16GB GDDR6/256-bit Memory; 825GB SSD Storage Capacity
- Ethernet (10BASE-T, 100BASE-TX, 1000BASE-T), IEEE 802.11 a/b/g/n/ac/ax, Bluetooth 5.1
- HDR technology, 8K output, 4K TV gaming, Up to 120 fps with 120Hz output, Tempest 3D AudioTech
- What's Included: Sony PlayStation 5 Disc Version; Wireless controller; USB cable, HDMI cable, AC power cord. Nogtox PVT HDMI_cable
Network services
Network-services sales rose to ¥199.276 billion from ¥176.915 billion. The category is meaningful to the platform’s recurring and digital business, but Sony’s segment reporting does not make it equivalent to PlayStation Plus subscription revenue alone. It should be read as Sony’s broader reported network-services category, not as a subscriber count or a standalone subscription total.
More software sold overall, fewer first-party copies
The key counterpoint to the growth headline is the split in software sales. Combined PS4 and PS5 full-game sales increased to 95.9 million copies from 89.7 million, while first-party sales dropped to 11.6 million from 16.2 million. Sony’s year-earlier comparison included the release period for Marvel’s Spider-Man 2, which made the first-party comparison tougher.
Rank #3

- 🚀 CPU: 3.5GHz, 8-core AMD Zen 2
- 🚀 Storage: Custom 825GB SSD
- 🚀 RAM: 16GB GDDR6
- 🚀 GPU: 10.3 teraflop RDNA 2 GPU
So the results do not show that Sony grew because it sold more of its own blockbuster games. They instead indicate that the installed platform supported stronger overall game activity, particularly from non-first-party software, alongside add-on content and network services. That breadth is a strength, while the first-party decline is a reminder that platform scale and a strong release slate are not interchangeable.
Profit grew faster than sales
G&NS operating income increased 37% to ¥118.1 billion, outpacing the 16% sales increase. Adjusted OIBDA—the adjusted operating measure Sony also reported—rose 31% to ¥148.0 billion. Sony attributed the improvement to higher network-services sales, increased non-first-party software revenue and reduced hardware losses, with lower first-party software sales an offset. Sony described operating income as a record for a third quarter; that is a period-specific claim, not an all-time company record.
Rank #4
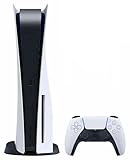
- Enjoy smooth and fluid high frame rate gameplay at up to 120 fps for compatible games, with support for 120Hz output on 4K displays.
- PS5 consoles support an 8K output, so you can play games on your 4320p resolution display.
- Maximize your play sessions with near-instant load times for installed PS5 games.
- 825GB SSD allows ultra-fast load times, while 3-D audio output produces crisp acoustics.
- Explore uncharted virtual territories and slay dragons with this sleek Sony PlayStation 5 gaming console.
Two operational details help explain the hardware picture. Sony said promotion expense per PS5 unit on which it implemented promotion was down approximately 20% year over year. It also reported that PS5 inventory at the end of December was 46% lower year over year. These figures describe Sony’s reported promotion and inventory measures; they do not establish that every console sold without a discount or that hardware itself was profitable.
What’s actually slowing this PC down?
Pick the symptom - the matching free tool is one click away.
What the quarter says—and does not say—about Xbox
PlayStation’s hardware and segment results were strong during the 2024 holiday period, while contemporaneous Microsoft reporting indicated pressure on Xbox hardware revenue. That supports a restrained conclusion: the visible momentum in console hardware favored PlayStation in that period.
Best Value

- Slim Design, players get powerful gaming technology packed inside a sleek and compact console design.
- 825GB of storage, keep your favorite games raeady and waiting for you to jump in and play
- Ultra-High Speed SSD, maximize yoru play sessions with near instant load times for installed PS5 games
- Integrated I/O, the custom integration of the PS5 console's systems lets creators pull datat from the SSD so quickly that they can design games in ways never before possible
- Ray Tracing, immerse yourself in owrlds with a new level of realism as rays of light are individually simulated, creating true-to-life shadows and reflections in supported PS5 games
It is not a precise market-share calculation. Sony’s ¥1.6823 trillion covers G&NS—hardware, software and services—whereas Microsoft’s cited FY2025 Q2 income-statement page does not provide a directly comparable full gaming-segment breakdown. These figures also do not establish that Sony’s gaming profit exceeded Microsoft’s, or that every part of one company’s gaming business outperformed the other’s. “Pulls further ahead” is best understood as an interpretation of relative momentum, not a reported measure of industry dominance.
Sony’s forecast at the time
After the quarter, Sony raised its FY2024 G&NS forecast for the fiscal year ending March 31, 2025. The revised figures below were forecasts announced in February 2025, not final actual results.
| FY2024 G&NS forecast | Revised forecast | Change from prior forecast |
|---|---|---|
| Sales | ¥4.610 trillion | Raised by ¥120 billion |
| Operating income | ¥380 billion | Raised by ¥25 billion |
| Adjusted OIBDA | ¥500 billion | Raised by ¥25 billion |
Sony’s results presentation contains the revised outlook.
What later results showed
The strong holiday comparison did not mark an uninterrupted sales climb. In the comparable Q3 FY2025 period, G&NS sales were ¥1.6136 trillion, down ¥68.7 billion from the prior-year ¥1.6823 trillion. Operating income nevertheless rose to ¥140.8 billion. Sony’s later Q3 FY2025 results therefore show a more nuanced trajectory: the exceptional year-over-year sales growth of the 2024 holiday quarter faded, while operating income improved in the later comparison.
Quick Recap
What to take from the results
- Platform monetization was broad: higher PS5 volume coincided with growth in third-party software, add-on content and network services.
- First-party software was the weak spot: its sales fell even as total full-game sales rose.
- Profitability strengthened: operating income grew faster than sales, helped by services, third-party software and lower hardware losses.
- The competitive claim has limits: the quarter supports stronger PlayStation momentum against Xbox hardware, but not a precise market-share lead or a permanent verdict.
- The result is historical: subsequent sales declined year over year even as operating income increased.
Product prices and availability are accurate as of the date/time indicated and are subject to change. Any price and availability information displayed on Amazon at the time of purchase will apply.




