What’s actually slowing this PC down?
Pick the symptom - the matching free tool is one click away.
Organizational chart pictures show who holds which role and how people or teams relate. The most useful chart is not simply a grid of employee portraits: it makes reporting or collaboration relationships clear. Choose a hierarchical, matrix, or flat layout to match the real structure, then decide whether to include names, titles, departments, and optional photos.
What an organizational chart picture shows
An organizational chart is a diagram of people or positions connected by relationships. In a company chart, those connections usually show who reports to whom; each box may identify a person, title, or group. Google’s Sheets documentation describes representing people and their manager or parent relationship, while Microsoft’s Visio guidance frames an org chart around reporting hierarchy.

Pictures of employees are optional. A chart can work as a clean diagram of names and roles without portraits; add headshots only when they help readers identify people and can be kept current.
Choose a layout that reflects the actual organization
| Layout | What it communicates | Useful when |
|---|---|---|
| Hierarchical | Levels of authority and reporting lines | Readers need to understand the chain of command or who reports to a manager. |
| Matrix | More than one working or reporting relationship | Project teams cross department boundaries and a single vertical chain would be misleading. |
| Flat | A structure with few or no visible management levels | The organization is small or wants to emphasize peer roles rather than a long hierarchy. |
Lucid’s template collection includes hierarchical, matrix, flat, and other examples. Browse its org chart templates for visual references, and check whether a specific template is marked free or paid before using it. Microsoft Visio documents eight layout options, so a hierarchical chart is not the only way to arrange its shapes.
#1 Best Overall

- MANY SIZES AND SHAPES- Perfect for computer science draftsmen, students, professionals, and anyone that needs accurate flow chart shapes. A useful tool to put your ideas and workflows down.
- HIGH QUALITY TEMPALTE - The high quality construction and small footprint of this circle template makes it easy to use and store. Plus, the translucent green plastic makes it easy to see your desired shape and marks the perfect spot every time.
- PRECISE MEASURING - Get exact measurements every time! It’s perfect for art or craft projects requiring precision such as sketching, drafting or drawing.
- VERSATILE – Great on a variety of surfaces like paper, vellum fabric canvas wood and mylar! Suitable for any project you have in mind.
- THE PERFECT GIFT - Gift this shape stencil to the artist in your life. Give them a practical, memorable gift that will further their creativity to the next level.
What to put in each box
Start with the information a reader needs to understand the structure. Names and titles are common choices; department or cost center can add context when the chart is meant for internal planning or administration. Visio supports these kinds of fields and allows pictures in chart shapes.
- Name: identifies the person occupying a position.
- Title: makes responsibilities or seniority easier to scan.
- Department or group: helps distinguish teams, especially in a larger chart.
- Photo: optional, and most useful when visual identification matters to the audience.
Keep the chart readable: include details that clarify roles or relationships, rather than turning every box into a miniature employee profile. If a portrait is included, use a current image and consider whether a static file or an externally hosted image is appropriate for how the chart will be shared.
Rank #2

- Constructed of durable, flexible plastic
- Lifetime warranty
- NSN: 7642-01-401-0068
Examples of organizational chart pictures
These simplified patterns show how the same roster can look different depending on the relationship the chart needs to explain.
Simple reporting hierarchy
Director → Manager → Team members. Use this arrangement when the main question is who reports to whom. Put the manager above their direct reports, and connect each person to the correct manager.
PC Slower Than It Used to Be?
A free scan shows the junk files, broken settings and background clutter dragging Windows down - then fixes them in one click.Free scan · Windows 10 & 11Outdated Drivers Are Slowing You Down
One free scan finds every outdated or missing driver and matches the right update for your exact hardware.Free scan · exact hardware matchRank #3

- Made from dimensionally stable 0.06" blue transparent shatter resistant plastic with matte finish to reduce glare
- Ink risers on reverse side prevent smudging
- Molded centerlines and printed labels and graduations for quick and accurate use
- Made from dimensionally stable 0.06" blue transparent shatter resistant plastic with matte finish to reduce glare ^Ink risers on reverse side prevent smudging ^Molded centerlines and printed labels and graduations for quick and accurate use
Department-based hierarchy
Company lead → Department heads → Team members. Label departments or use consistent colors to distinguish groups, while retaining clear reporting connections.
Matrix or project-team view
Show a person’s department affiliation alongside their project-team relationship when both matter. A matrix view can make cross-department collaboration visible, but label the relationship types clearly so readers do not mistake a project connection for a direct reporting line.
Make an editable organizational chart in Google Sheets
Google Sheets can turn a small, structured roster into an organizational chart. Each row represents one person, with the person’s name in the first column and their manager, parent, or other hierarchical relationship in the second. A third column can provide optional notes that appear on hover.
- Prepare a roster with one row per person. Use consistent names in both the name and manager fields; use the same relationship labels throughout.
- In Google Sheets, select the roster and choose Insert > Chart.
- In the Chart editor, select Organizational chart as the chart type.
- Use the chart customization controls to adjust box size and color for legibility.
Google’s instructions and data expectations are in its organizational chart help page. This route is useful when the source roster already lives in a spreadsheet and you want a chart that can be regenerated as the data changes.
Best Value
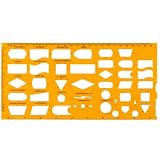
- Versatile Flowchart Template: The 10x5 inch yellow flexible plastic flowchart template gives a wide variety of shapes, making it perfect for creating flowcharts, diagrams, organizational charts, and more. It's ideal for students, professionals, and designers who need an efficient tool for drafting.
- Perfect for Drafting & Drawing: Designed with flexibility in mind, this template is excellent for both drafting and freehand drawing. It's an essential tool for professionals, engineers, students, or anyone in need of precise and organized diagrams.
- Convenient Scale for Accuracy: Featuring a built-in scale, this template allows you to create precise and accurate flowcharts and diagrams. The scale ensures that every shape and line is perfectly proportioned, providing a high level of consistency in your designs.
- Sturdy & Flexible Material: Crafted from plastic, this template is flexible yet strong, allowing for smooth and easy use on a variety of surfaces. It won't bend or crack easily, ensuring that you can rely on it for long-term use.
- Easy to Use: Whether you're an experienced designer or just starting out, this flowchart template is simple to use. The assorted shapes and clear markings make it easy to create professional-quality diagrams and flowcharts with minimal effort.
Create a chart from employee data in Visio
Visio’s employee-data workflow requires employee names and reports-to information in the source data. Additional fields can supply details such as title, department, or cost center; pictures can be included in shapes. Microsoft also documents generating organizational charts from Excel data or delimited text.
- Prepare the employee data with a name field and a reports-to field for each employee.
- Use Visio’s organizational chart data workflow to create the chart from the roster.
- Add optional fields or pictures only where they help the intended audience interpret the chart.
- Review the generated reporting lines against the source roster before sharing.
See Microsoft’s instructions for creating an org chart automatically from employee data and its overview of Visio chart layouts and shapes.
Use a Lucid template or import a roster
Lucid’s org chart options range from basic and hierarchical charts to matrix, flat, and HR examples. Its documented import options include CSV, Excel, Google Sheets, and BambooHR. Users can customize shapes and add a headshot by uploading it or entering a publicly hosted image URL. See Lucid’s org chart maker features and template gallery.
A template is a useful starting point for design, but a gallery image may be illustrative rather than a live chart connected to your roster. Choose an editable format if the organization will change, and check the provider’s current account requirements and template availability before relying on a particular feature.
Recommended Free Tools
Choose between a picture and a chart you can maintain
A static picture is suitable for a presentation, a one-time handout, or a visual example. If the chart needs regular updates, build it from a roster or use an editable template: changes to reporting lines, roles, or staff can otherwise leave the image out of date. For any workflow, establish a current source of names and reporting relationships first, then verify the chart against it before distributing the result.
Quick Recap
Product prices and availability are accurate as of the date/time indicated and are subject to change. Any price and availability information displayed on Amazon at the time of purchase will apply.




