Evaluate construction equipment stocks by testing five things in order: what the company actually sells, where its customers are in the equipment cycle, whether dealer shipments match end-user demand, how resilient the business is financially, and whether the stock price makes sense against normalized results. Rising construction spending alone is not enough: it does not show which manufacturers will benefit, when that benefit will appear in reported sales, or whether the shares already reflect it.
Start by identifying what the company sells
Read the latest annual report and map each reportable segment to its products, customers, and regions. Manufacturers can have very different businesses under the same broad “construction equipment” label. Caterpillar reports Construction Industries and Resource Industries alongside Power & Energy; Deere combines construction and forestry in one segment; CNH reports construction alongside agriculture. Their consolidated revenue is therefore not directly comparable as a measure of construction-equipment exposure.
For each company, record:
- Products: for example, heavy earthmoving machines, compact equipment, forestry machines, or attachments.
- End markets: infrastructure, housing, commercial building, mining, energy, forestry, aggregates, and rental.
- Geography: where machines are sold and where customers earn revenue.
- Other businesses: agriculture, power systems, parts and service, or a finance arm that may affect consolidated results.
A useful first screen is to compare segment revenue and operating profit over several years, not just the company’s total sales. Check whether a segment’s definition or reporting structure changed; if it did, use the company’s reconciliations where available rather than treating unlike figures as comparable.
Where is the company in the equipment cycle?
Construction machinery demand is cyclical, but the drivers differ by machine type and customer. Infrastructure, mining, energy, and large projects can support heavier equipment; housing, commercial construction, contractors, and rental activity can be more important for light equipment. Interest rates, credit availability, public and private investment, and customer confidence can all influence purchase timing.
The Tool Desk
Outbyte PC Repair FREEClear out junk files and repair common Windows errorsFree Scan →Outbyte Driver Updater FREEFix the driver behind crashes, sound loss and screen glitchesFind Drivers →#1 Best Overall

- REALISTIC CONSTRUCTION EXPERIENCE – Dive into the world of heavy machinery with this 2.4GHz remote control bulldozer! Complete with working lights and realistic engine sounds, this 1:20 scale bulldozer offers a lifelike construction adventure for kids and adults alike. (Overall Size: 9.5" L × 5.1" W × 4.2" H)
- MULTI-FUNCTIONAL POWERHOUSE – Command 9 control channels for full operation—drive, rotate 360°, lift, and dig with precision. The alloy dozer blade and adjustable metal looseners replicate real-world motion, letting you perform authentic construction tasks indoors or outdoors
- EXTENDED PLAYTIME & BEGINNER-FRIENDLY – Includes two 3.7 V rechargeable batteries for up to 60 minutes of nonstop play (30 mins each). Smooth controls make it perfect for beginners while still powerful enough for seasoned RC enthusiasts
- DURABLE BUILD FOR ALL TERRAINS – Designed to handle cement, dirt, sand, and grass, this bulldozer’s strong motor and rugged construction stand up to tough play. Perfect for indoor and outdoor fun, it’s a top-rated Christmas or birthday STEM gift for kids 3 – 30!
- DETAILS THAT BRING IT TO LIFE – Experience realistic triangular track wheels, simulated hydraulic movement, and switchable sound for quieter indoor sessions. Every model is carefully tested for quality and backed by professional customer support—play with confidence!
Use indicators as context, not as a substitute for company evidence
The U.S. Census Bureau’s Value of Construction Put in Place survey estimates the monthly dollar value of work done on new structures and improvements across public and private sectors. Manufacturing new orders are intended to indicate future production commitments. Both can help describe the U.S. backdrop, but neither measures demand for one manufacturer’s machines. For any indicator, check its geography, category, reporting period, release date, units, and revisions.
Then compare that backdrop with company disclosures: end-user retail activity, order rates, cancellations, backlog, management’s regional commentary, and rental-fleet utilization where reported. Do not assume that a national construction-spending increase benefits every product line or region equally.
Interpret company cycle commentary cautiously
CNH’s 2025 filing described heavy-equipment demand as generally following macroeconomic cyclicality linked to GDP and government spending. It also said light-equipment demand is influenced by construction and financing conditions and has historically tended to mirror U.S. and European housing starts with a six-to-twelve-month lag. That is the company’s description of historical patterns, not a dependable forecasting rule for a particular year or market.
Do factory shipments reflect final demand?
Often, not immediately. Many manufacturers sell through independent dealers. A manufacturer’s shipment to a dealer can be recorded before the dealer sells the machine to an end user. Caterpillar’s 2025 10-K describes this timing difference and says the majority of its machinery and power systems are sold to independently owned dealers and OEMs.
Rank #2

- Alloy made. Exceptional high quality moving vehicles are made of strong die-cast metal that can stand rough play.
- Realistic vehicles help kids learn about the structures, working principles and applications of machinery in real life.
- Sturdy parts allow Excavator to rotate, Dump Truck to unload, and Bulldozer bucket to rise, which develops kids fine finger skills.
- Excellent for role playing games and suitable for sandpits. Recommended toys for 3-6 years old toddler boys, girls, kids, children.
- Awesome gift for birthday, festivals and holidays. Give your child a construction gift that creates endless happy moments!
Read these measures together rather than interpreting reported shipments in isolation:
- Retail sales: machines sold by dealers to end users, where disclosed.
- Dealer inventory: whether channel stock is building or being drawn down.
- Orders and cancellations: evidence of current customer commitments and changes in them.
- Backlog: orders awaiting delivery, considered alongside timing, product mix, pricing, and cancellation rights.
- Management’s explanation: why shipments, retail activity, and inventory moved differently.
If shipments rise while dealer inventories accumulate, the increase may not represent an equivalent rise in end-user demand. Dealer destocking can also hold down manufacturer shipments even when retail sales are steadier. Backlog is not guaranteed future revenue: delivery delays, product mix, and cancellation terms matter.
How strong is the competitive position?
Compare manufacturers against relevant rivals by product line and geography, not simply by company size. CNH’s 2025 annual filing names competitors that include Caterpillar, Komatsu, JCB, Hitachi Construction Machinery, Volvo, Liebherr, Develon, Bobcat, Kubota, Sany, and Deere. These firms do not compete identically across every machine category or region.
Assess the factors that can influence customers’ purchase and ownership decisions:
Rank #3
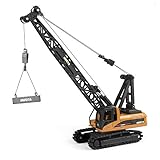
- ✔Heavy duty construction toys, sturdy metal, safe & reliable
- ✔1/50 Scale, Size: approx 4.8"(L) * 2.8"(W) * 9.25"(H)
- ✔Made of diecast metal with some small plastic parts
- ✔The crane cabin can perform 360 degree rotations.Both lifting arm and hook can be controlled separately by manual operation,looks really true to life
- ✔Realistic details and functions encourage imaginative play. Great for use indoors and outdoors
- Machine performance, reliability, uptime, fuel efficiency, and ability to meet changing technology requirements.
- Dealer coverage, parts availability, service capacity, and support for rental customers.
- Price competitiveness, product mix, and the ability to maintain realized prices as demand changes.
- Financing availability and the role of promotional financing in supporting purchases.
A dealer network and aftermarket business can support customer relationships and parts demand, but they do not eliminate exposure to downturns. Check service revenue and margins over time, and consider whether used-equipment values, rental exposure, or dealer financial health could add pressure.
What should you examine in the financial statements?
Use several years of annual and quarterly filings to see how the business behaves across different conditions. The SEC’s investor education material describes common measures such as operating margin, inventory turnover, debt-to-equity, and price-to-earnings ratios, while cautioning that appropriate ratios vary by industry. Use ratios to compare a company with its own history and relevant peers, not against universal cutoffs.
| Area | What to compare | Why it matters |
|---|---|---|
| Segment performance | Sales, unit volume where disclosed, pricing, product mix, and operating margin | Shows which business lines drive results and whether earnings changes come from volume, pricing, or costs. |
| Cash generation | Cash from operations, capital expenditure, and free cash flow using a consistent definition | Tests whether earnings translate into cash after investment needs. |
| Working capital | Inventory, receivables, payables, and cash conversion relative to sales | Production and dealer-channel changes can absorb or release cash before retail demand changes are fully reflected. |
| Costs and margins | Material and labor costs, tariffs, currency, restructuring, and other disclosed drivers | Helps distinguish operating improvement from temporary or nonrecurring effects. |
| Debt and obligations | Borrowings, liquidity, leases, pension obligations, and finance-subsidiary funding | Shows financial commitments that may become more burdensome when earnings weaken. |
Look at inventory growth relative to sales and ask whether a change in cash flow reflects durable operations or a temporary movement in inventory, receivables, or payables. When margins change, identify the stated drivers—such as volume, price realization, input costs, product mix, restructuring, tariffs, or currency—instead of assuming that one strong quarter represents a lasting trend.
How should you assess a manufacturer’s finance arm?
An affiliated finance business can help customers buy equipment and dealers carry inventory. It is also a separate source of credit, funding, and interest-rate risk. Review its results and exposures on their own terms rather than treating the finance operation as ordinary machinery manufacturing.
What’s actually slowing this PC down?
Pick the symptom - the matching free tool is one click away.
Rank #4

- 【High quality】Die-cast model 2 in 1 construction toy set comes with 1 die-cast excavator and 1 die-cast dump truck
- 【Provide Imagination】Will provide hours of imagination play for kids. Also great as a collectible item or to have it nicely displayed
- 【Simulation】The Metal Die-cast Excavator looks like a real-life heavy-duty construction vehicle you typically see on a construction site with extremely detailed exterior
- 【Lifelike Details】Die-cast Model High Quality & Great Details, so that you will be able to experience the reality of the Engineering Machine at home
- 【Notice】The product consists of 70% metal and 30% plastic, Have Small parts. Not for children under 3 yrs.
- Track finance-segment revenue and profit, receivables, delinquencies, and loss provisions.
- Review funding sources and maturities, and how sensitive the business may be to financing costs.
- Check how much equipment demand depends on promotional financing.
- Compare finance operations cautiously: segment definitions, funding arrangements, and balance-sheet presentation differ between companies.
Can the balance sheet support capital returns?
Assess debt and liquidity alongside capital expenditure, dividends, share repurchases, acquisitions, leases, pensions, and finance-subsidiary funding. Ask whether distributions remain supported by cash generation in weaker years, not only during peak-cycle earnings. A high payout during a strong period is not by itself evidence that the same pace is sustainable through a downturn.
Use each issuer’s newest annual and quarterly filings to populate a current comparison. Do not infer that one manufacturer has the strongest balance sheet without comparable, up-to-date figures and consistent treatment of finance operations and other obligations.
Independent reader supportYour contribution helps us test, update, and keep practical guides available for everyone.How do you value the shares through a cycle?
A single-year price-to-earnings ratio can mislead when earnings are unusually high or low. Consider measures such as P/E, enterprise value to operating earnings, and free-cash-flow yield only after defining the calculation and using comparable periods. Then compare the result with the company’s own history and relevant peers, accounting for cycle position, segment mix, debt, finance operations, and unusual items.
A practical valuation check is to ask what happens to the multiple if earnings normalize from a strong year, or if margins and volumes weaken. A low multiple on peak earnings may not be cheap; a high multiple on depressed earnings may not by itself establish that a stock is expensive. The SEC ratio guide defines common measures but does not prescribe a fair multiple or identify a buy price.
Free tools Windows power users keep installed
One-click scans. No signup required.
Best Value

- Diecast Masters | 1:87 Scale Cat CT660 Day Cab Tractor with Lowboy Trailer and Cat 163H Motor Grader | Model 84414
Do not use a sector-wide “normal” multiple without a sourced basis. No current market prices or comparable valuation multiples are established here, so this framework does not rank particular stocks or supply a price target.
Build a company comparison before deciding
For each candidate, fill in the same evidence categories from the latest filings and market data. Record the date and definition for every figure so that a stale annual result is not mistaken for the current cycle.
| Comparison axis | Evidence to collect |
|---|---|
| End-market and geography | Construction, mining, energy, infrastructure, housing, rental, and regional exposure by segment. |
| Demand and cycle | End-user sales, orders, backlog, dealer inventory, and management’s stated cycle assumptions. |
| Product and channel | Product categories, relevant competitors, dealer reach, parts and service, reliability, rental support, and pricing. |
| Financial quality | Segment margins, cash conversion, inventory, capital spending, debt, and finance-arm risks. |
| Valuation | Multiples based on normalized earnings or cash flow, the company’s historical range, and a clearly defined peer set. |
| Risks | Rates and credit, project delays, regional exposure, currency, tariffs, regulation, competition, supply disruptions, and dealer health. |
Which risks can change the investment case?
Weak business confidence, reduced government or private investment, tighter credit, or lower construction activity can reduce demand. Rental fleets may expand or contract as utilization and rental rates change. Dealer inventory can amplify the difference between manufacturer shipments and end-user sales. Currency movements, tariffs, supply disruptions, regional conditions, competition, and evolving emissions or safety requirements can also affect costs and results. These are risks identified in company filings, not predictions that each will occur.
Use the newest 10-K or annual report for segment definitions, risk factors, debt, and management’s outlook, then review the newest quarterly filing and earnings materials for changes since year-end. Keep company forecasts labeled as management expectations, with their date and assumptions; they are not realized results or independent forecasts. For public indicators, note the publisher, measure, period, geography, units, release date, and revision status.
Quick wins for a faster PC:
Fix the driver behind crashes, sound loss and screen glitchesFind Drivers →Repair Windows errors before they cause bigger problemsFix Now →Scan for outdated or missing drivers - takes under a minuteDriver Scan →This framework is for education, not individualized financial advice. Whether an individual stock is suitable depends on its current price, the investor’s circumstances, and risks not resolved by a company comparison.
Quick Recap
Product prices and availability are accurate as of the date/time indicated and are subject to change. Any price and availability information displayed on Amazon at the time of purchase will apply.




