Free tools Windows power users keep installed
One-click scans. No signup required.
A gold-silver ratio of 68 means one ounce of gold is quoted at the same spot value as 68 ounces of silver, when both prices use the same currency, unit and timestamp. It does not prove gold is overpriced or tell investors to sell: a July 2026 estimate put the ratio’s long-run equilibrium just under 60, but that historical model is not a price target or a timetable for a move. The figure 68 is treated here as the topic’s supplied snapshot, not a verified live quote.
What does a gold-silver ratio of 68 mean?
Calculate the ratio by dividing the spot price of one troy ounce of gold by the spot price of one troy ounce of silver, using matching currencies and a matching timestamp. At 68, one ounce of gold has the same quoted spot value as 68 ounces of silver. The ratio describes their relative market prices; it does not measure either metal’s intrinsic value or say how many retail coins could be exchanged without costs.


Because the ratio can change with prices, a number without a timestamp and price convention is not a dependable “current” reading. To check a live ratio, use synchronized gold and silver spot quotes in the same currency and per-ounce unit, then divide gold by silver. Retail bullion prices will differ from spot values because of premiums and transaction costs.
Why 68 looks high against a recent long-run estimate
A Silver Institute release dated July 21, 2026, summarizing a report by Precious Metals Insights, says the ratio is not a random walk and estimates a long-run mean-reverting equilibrium just under 60:1 for January 1970 through May 2026. The release describes the end of formal bimetallic standards through 1971 as a structural shift in the baseline. Against that particular estimate, 68 is elevated.
The Tool Desk
Outbyte PC Repair FREERepair Windows errors before they cause bigger problemsFix Now →Outbyte Driver Updater FREEScan for outdated or missing drivers - takes under a minuteDriver Scan →#1 Best Overall
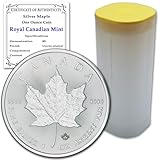
- Purity: .9999 Fine Silver
- Diameter: 38 mm; Thickness: 3.29 mm
- Metal Content: 1 Troy Ounce per Coin; Total: 25 Troy Ounces
- Stock Photo; Image is indicative of quality; Coins will come with twenty-five certificates of authenticity
- You will receive twenty-five coins with an original Royal Canadian Mint acrylic tube; DISCLAIMER: Please note that we pull random year coins from the same tube, so all coins received per purchase will be from the same year— mixed bags are highly unlikely, ensuring a consistent and uniform collection for your enjoyment!
That comparison is context, not a rule that the ratio must fall to 60, a forecast of when it might do so, or a short-term trading signal. The study identifies above-ground bullion stocks acting alongside relative investment demand as the primary driver. It also concludes that very high central-bank gold bullion demand in recent years has likely pushed the ratio above its estimated long-run level. That conclusion helps explain the gap; it does not establish that gold is certain to decline or silver to rise.
The estimate belongs to the study’s model, sample period and post-bimetallic monetary context. It should not be treated as a timeless universal “fair value” for the two metals.
Is gold expensive compared with silver?
The ratio can show that gold has become more expensive relative to silver, or that silver has become cheaper relative to gold. It cannot by itself determine whether either metal is expensive in absolute terms. Gold and silver respond to overlapping but different forces, so a high ratio may reflect gold demand, silver weakness, or both.
Demand and supply differ
In a March 2026 comparison, the World Gold Council describes gold demand as spanning consumer and investment roles, with central-bank demand also material. Silver demand is more strongly shaped by industrial use. The Council reports that roughly 70–80% of silver is mined as a by-product of copper, lead and zinc production, leaving silver supply exposed to the fortunes of those sectors as well as to silver prices.
Quick wins for a faster PC:
Scan for outdated or missing drivers - takes under a minuteDriver Scan →Repair Windows errors before they cause bigger problemsFix Now →Fix the driver behind crashes, sound loss and screen glitchesFind Drivers →Rank #3
- Purity: .9999 Fine Silver
- Diameter: 38 mm; Thickness: 3.29 mm
- Metal Content: 1 Troy Ounce per Coin; Total: 10 Troy Ounces
- Stock Photo; Image is indicative of quality; Maple Tubes Available with coins while supplies last
- DISCLAIMER: Please note that we pull random year coins from the same tube, so all coins received per purchase will be from the same year— mixed bags are highly unlikely, ensuring a consistent and uniform collection for your enjoyment!
Recycling is another difference, though the figures use different denominators: the World Gold Council says gold recycling contributes roughly one-third of global supply, while silver recycling covers about 19% of demand, citing the Silver Institute’s 2025 Survey for the latter. These are reported industry estimates, not fixed shares for every year.
Silver has had greater volatility
The World Gold Council reports that silver volatility was roughly twice gold’s over January 1, 1991–March 12, 2026. It characterizes gold as the more defensive, lower-volatility diversifier and silver as a hybrid precious and industrial metal with greater equity sensitivity during drawdowns. Silver has not consistently provided the crisis diversification associated with gold.
Rank #4

- ✔️Each coin contains 1/10 oz of gold.
- ✔️Obverse: Lady Liberty holding a torch with an olive branch.
- ✔️Reverse: The Type 1 reverse, used from 1986-2021, shows a male bald eagle in flight carrying an olive branch to his nest, where a female awaits with her young. The Type 2 reverse, introduced in 2021, shows a bold close-up portrait of an eagle.
- ✔️Each Gold Eagle is a sovereign monetized bullion coin fully guaranteed by the U.S. Mint.
One historical example is the Council’s report that gold rose 21% in US dollars from December 2007 to February 2009, based on the LBMA Gold Price PM. That is an observation about a past period, not a promise of protection in a future crisis.
Market depth and trading costs are not identical
The World Gold Council’s March 2026 article says gold’s market is substantially larger and more liquid. Its five-year average daily trading-volume estimates, with data cut off February 27, 2026, were:
Best Value
| Market category | Gold, average daily volume | Silver, average daily volume |
|---|---|---|
| ETFs | US$2.3 billion | US$0.7 billion |
| Futures | US$55 billion | US$11 billion |
| Over-the-counter (OTC) | US$97 billion | US$13 billion |
For one-minute observations from February 5, 2025, through February 17, 2026, the Council reports average intraday spreads of 2 basis points for gold and 9 basis points for silver. These figures describe the markets and periods cited; the spread an individual investor pays depends on the instrument and venue.
In practical terms, “gold looks expensive” is incomplete without asking what the exposure is meant to do. An investor prioritizing a historically more defensive diversifier is making a different choice from someone seeking silver’s more cyclical, industrially exposed profile.
Independent reader supportYour contribution helps us test, update, and keep practical guides available for everyone.Should investors stay invested?
The ratio alone cannot answer that question. Whether to keep, reduce or add exposure depends on the job the metal is meant to perform in a portfolio, the investor’s time horizon and risk capacity, and the size of the position relative to other assets. A long-run mean-reversion estimate does not say when the ratio will move, and a high ratio is not a substitute for deciding whether the original investment case still fits.
- Purpose: Identify whether the holding is intended for diversification, a monetary or inflation-related role, or exposure to industrial demand. Gold and silver do not serve those purposes in the same way.
- Risk budget: Consider whether the portfolio can tolerate silver’s historically higher volatility and greater industrial and equity sensitivity, or whether gold’s comparatively defensive profile is more relevant.
- Concentration: Review the holding as a share of the whole portfolio. A ratio reading does not reveal whether an investor has too much exposure to one metal.
- Horizon and liquidity: A relative-price signal can remain away from a historical estimate for an extended period. Consider when the money may be needed and whether the investment can be sold on acceptable terms.
- Instrument and costs: ETFs, futures, OTC exposure and physical bullion have different trading, custody and transaction arrangements. The ratio is a spot-price comparison, not a measure of those costs.
This is a framework for weighing the signal, not individualized financial advice. Investors making a portfolio change may also need to account for their circumstances and applicable local rules.
Do these 3 things before closing this tab:
1Repair Windows errors before they cause bigger problems2Scan for outdated or missing drivers - takes under a minute3Clear out junk files and repair common Windows errorsHow physical bullion changes the comparison
If considering physical gold or silver, spot-ratio arithmetic does not equal a retail exchange rate. Coin and bar prices can include premiums over spot, and the price received on resale may be below the purchase price. Compare the full buy and sell terms, including dealer spreads or buyback terms, delivery, secure storage, insurance and custody. Local tax treatment varies by jurisdiction; the sources cited here do not establish rules for any particular location.
Quick Recap
Sources
- Silver Institute, “Gold:Silver Ratio Continues to be Relevant in the Modern Era,” July 21, 2026.
- World Gold Council, “Gold the safe haven versus silver the wildcard,” March 18, 2026.
- World Gold Council, “Gold as a strategic asset: 2026 edition — Gold’s key attributes: Diversification,” February 4, 2026.
Product prices and availability are accurate as of the date/time indicated and are subject to change. Any price and availability information displayed on Amazon at the time of purchase will apply.




