Recommended Free Tools
The United States had 1,900,487 farms operating 880.1 million acres in 2022, an average of 463 acres per farm (USDA NASS, 2022; c002). Those national figures conceal major differences: farm counts, acreage, sales, income and commodities vary sharply by state. This guide explains what each measure means, gives the complete 50-state reference framework, and shows how to interpret the latest annual income estimates without confusing sales with profit.
What the 2022 Census says about U.S. agriculture
The 2022 Census of Agriculture is the latest comprehensive, five-year structural snapshot. It counted 1,900,487 farms and 880.1 million acres of land in farms, with an average farm size of 463 acres. Farmland represented 39% of U.S. land. Compared with 2017, the number of farms fell 6.9%, land in farms fell 2.2%, and average farm size increased 5.0% (USDA NASS, 2022; c002).
As an Amazon Associate I earn from qualifying purchases.
Those operations generated $543 billion in agricultural-product sales/output, incurred $424 billion in production expenses, and produced $152 billion in net cash income in 2022. Forty-three percent of farms reported positive net cash farm income (USDA NASS, 2022; c003). Family-owned and operated farms accounted for 95% of farms and operated 84% of farm land (USDA NASS, 2022; c004).
NASS Administrator Hubert Hamer summarized the purpose of the release: “Census of Agriculture data tell a story.” — Hubert Hamer, NASS Administrator, 2024 release (c001).
#1 Best Overall

- Quick, at home results for Soil pH, Nitrogen, Phosphorous and Potash Innovative and inexpensive soil test kit features an easy-to-use capsule system and patented color comparators
- Contains all components needed for 20 tests. 5 for each of pH, N, P and K
- Contains all components needed to test all variables in several spots in the yard or garden
- Simple, detailed instructions included. Great for beginners and experienced gardeners alike.
- Soil pH preference list for over 450 plants included
How to read the state-by-state measures
Farm count
“Number of farms” counts operations meeting the Census definition in each state. A high count does not mean a state has the most acreage or the highest farm income.
Land in farms and average farm size
Land in farms is the total acres reported as part of farm operations. Average farm size is land in farms divided by the number of farms. Large western and Great Plains operations can raise a state’s average even when the state has relatively few farms.
Sales or cash receipts
Market value of agricultural products sold is a Census measure for the reference year. ERS cash receipts are an annual measure of money received from marketed commodities. Both are revenue measures, not profit, and nominal-dollar comparisons must retain the year attached to them.
Rank #2

- KNOW BEFORE YOU GROW | Grow the healthiest, sustainable lawn and garden with the most accurate and easy to use professional soil test kit on the market
- FAST & ACCURATE | Unlike at-home pH meters and test strips, our mail-in professional lab analysis accurately measures 13 plant-available nutrient levels, including Nitrogen and pH. Results in 6-8 days
- FOR ANY GROWING SCENARIO | Tests any soil type and growing condition - lawn & turf, vegetable gardening, flowers, compost, trees, vines, ornamental landscape, house plants, soil-less media or hydroponics
- SAVE TIME & MONEY | Stop applying products you don’t need. Learn exactly what products and amounts you need to grow the healthiest plants possible
- CUSTOM RECOMMENDATIONS | What to apply, how much to apply, and when to apply it. Provides both organic and non-organic fertilizer recommendations to effectively amend your soil
Net cash income versus net farm income
Net cash farm income subtracts cash operating expenses from cash receipts and related cash income. ERS net farm income is broader: it includes noncash items such as depreciation and imputed rental income. ERS also reports a net-farm-income ratio—net farm income per dollar of production plus direct government payments (ERS; c010). Because the concepts differ, a Census sales total should not be compared directly with an ERS net-income estimate.
50-state reference: farms, farmland, sales and income
The 2022 Census “U.S. Summary and State Data” tables provide the structural columns below; the annual ERS state files provide income and cash-receipt measures. In the source material available for this article, individual state values are not stated, so each cell is labeled accordingly rather than estimated. Use the Census tables (USDA NASS, c005) and the latest ERS state files (USDA ERS, c006) for the numeric state series. “Leading commodities” must be read with its year and definition because a state can lead in production, sales or receipts for different commodities.
| State | Farms (2022 Census) | Land in farms, acres (2022 Census) | Average acres per farm (2022 Census) | Sales or cash receipts (year/measure) | Net farm income or net cash income (year/measure) | Leading commodities (year/measure) |
|---|---|---|---|---|---|---|
| Alabama | not stated (c005) | not stated (c005) | not stated (c005) | not stated (c005/c006) | not stated (c006) | not stated (c005/c006) |
| Alaska | not stated (c005) | not stated (c005) | not stated (c005) | not stated (c005/c006) | not stated (c006) | not stated (c005/c006) |
| Arizona | not stated (c005) | not stated (c005) | not stated (c005) | not stated (c005/c006) | not stated (c006) | not stated (c005/c006) |
| Arkansas | not stated (c005) | not stated (c005) | not stated (c005) | not stated (c005/c006) | not stated (c006) | not stated (c005/c006) |
| California | not stated (c005) | not stated (c005) | not stated (c005) | not stated (c005/c006) | not stated (c006) | not stated (c005/c006) |
| Colorado | not stated (c005) | not stated (c005) | not stated (c005) | not stated (c005/c006) | not stated (c006) | not stated (c005/c006) |
| Connecticut | not stated (c005) | not stated (c005) | not stated (c005) | not stated (c005/c006) | not stated (c006) | not stated (c005/c006) |
| Delaware | not stated (c005) | not stated (c005) | not stated (c005) | not stated (c005/c006) | not stated (c006) | not stated (c005/c006) |
| Florida | not stated (c005) | not stated (c005) | not stated (c005) | not stated (c005/c006) | not stated (c006) | not stated (c005/c006) |
| Georgia | not stated (c005) | not stated (c005) | not stated (c005) | not stated (c005/c006) | not stated (c006) | not stated (c005/c006) |
| Hawaii | not stated (c005) | not stated (c005) | not stated (c005) | not stated (c005/c006) | not stated (c006) | not stated (c005/c006) |
| Idaho | not stated (c005) | not stated (c005) | not stated (c005) | not stated (c005/c006) | not stated (c006) | not stated (c005/c006) |
| Illinois | not stated (c005) | not stated (c005) | not stated (c005) | not stated (c005/c006) | not stated (c006) | not stated (c005/c006) |
| Indiana | not stated (c005) | not stated (c005) | not stated (c005) | not stated (c005/c006) | not stated (c006) | not stated (c005/c006) |
| Iowa | not stated (c005) | not stated (c005) | not stated (c005) | not stated (c005/c006) | not stated (c006) | not stated (c005/c006) |
| Kansas | not stated (c005) | not stated (c005) | not stated (c005) | not stated (c005/c006) | not stated (c006) | not stated (c005/c006) |
| Kentucky | not stated (c005) | not stated (c005) | not stated (c005) | not stated (c005/c006) | not stated (c006) | not stated (c005/c006) |
| Louisiana | not stated (c005) | not stated (c005) | not stated (c005) | not stated (c005/c006) | not stated (c006) | not stated (c005/c006) |
| Maine | not stated (c005) | not stated (c005) | not stated (c005) | not stated (c005/c006) | not stated (c006) | not stated (c005/c006) |
| Maryland | not stated (c005) | not stated (c005) | not stated (c005) | not stated (c005/c006) | not stated (c006) | not stated (c005/c006) |
| Massachusetts | not stated (c005) | not stated (c005) | not stated (c005) | not stated (c005/c006) | not stated (c006) | not stated (c005/c006) |
| Michigan | not stated (c005) | not stated (c005) | not stated (c005) | not stated (c005/c006) | not stated (c006) | not stated (c005/c006) |
| Minnesota | not stated (c005) | not stated (c005) | not stated (c005) | not stated (c005/c006) | not stated (c006) | not stated (c005/c006) |
| Mississippi | not stated (c005) | not stated (c005) | not stated (c005) | not stated (c005/c006) | not stated (c006) | not stated (c005/c006) |
| Missouri | not stated (c005) | not stated (c005) | not stated (c005) | not stated (c005/c006) | not stated (c006) | not stated (c005/c006) |
| Montana | not stated (c005) | not stated (c005) | not stated (c005) | not stated (c005/c006) | not stated (c006) | not stated (c005/c006) |
| Nebraska | not stated (c005) | not stated (c005) | not stated (c005) | not stated (c005/c006) | not stated (c006) | not stated (c005/c006) |
| Nevada | not stated (c005) | not stated (c005) | not stated (c005) | not stated (c005/c006) | not stated (c006) | not stated (c005/c006) |
| New Hampshire | not stated (c005) | not stated (c005) | not stated (c005) | not stated (c005/c006) | not stated (c006) | not stated (c005/c006) |
| New Jersey | not stated (c005) | not stated (c005) | not stated (c005) | not stated (c005/c006) | not stated (c006) | not stated (c005/c006) |
| New Mexico | not stated (c005) | not stated (c005) | not stated (c005) | not stated (c005/c006) | not stated (c006) | not stated (c005/c006) |
| New York | not stated (c005) | not stated (c005) | not stated (c005) | not stated (c005/c006) | not stated (c006) | not stated (c005/c006) |
| North Carolina | not stated (c005) | not stated (c005) | not stated (c005) | not stated (c005/c006) | not stated (c006) | not stated (c005/c006) |
| North Dakota | not stated (c005) | not stated (c005) | not stated (c005) | not stated (c005/c006) | not stated (c006) | not stated (c005/c006) |
| Ohio | not stated (c005) | not stated (c005) | not stated (c005) | not stated (c005/c006) | not stated (c006) | not stated (c005/c006) |
| Oklahoma | not stated (c005) | not stated (c005) | not stated (c005) | not stated (c005/c006) | not stated (c006) | not stated (c005/c006) |
| Oregon | not stated (c005) | not stated (c005) | not stated (c005) | not stated (c005/c006) | not stated (c006) | not stated (c005/c006) |
| Pennsylvania | not stated (c005) | not stated (c005) | not stated (c005) | not stated (c005/c006) | not stated (c006) | not stated (c005/c006) |
| Rhode Island | not stated (c005) | not stated (c005) | not stated (c005) | not stated (c005/c006) | not stated (c006) | not stated (c005/c006) |
| South Carolina | not stated (c005) | not stated (c005) | not stated (c005) | not stated (c005/c006) | not stated (c006) | not stated (c005/c006) |
| South Dakota | not stated (c005) | not stated (c005) | not stated (c005) | not stated (c005/c006) | not stated (c006) | not stated (c005/c006) |
| Tennessee | not stated (c005) | not stated (c005) | not stated (c005) | not stated (c005/c006) | not stated (c006) | not stated (c005/c006) |
| Texas | not stated (c005) | not stated (c005) | not stated (c005) | not stated (c005/c006) | not stated (c006) | not stated (c005/c006) |
| Utah | not stated (c005) | not stated (c005) | not stated (c005) | not stated (c005/c006) | not stated (c006) | not stated (c005/c006) |
| Vermont | not stated (c005) | not stated (c005) | not stated (c005) | not stated (c005/c006) | not stated (c006) | not stated (c005/c006) |
| Virginia | not stated (c005) | not stated (c005) | not stated (c005) | not stated (c005/c006) | not stated (c006) | not stated (c005/c006) |
| Washington | not stated (c005) | not stated (c005) | not stated (c005) | not stated (c005/c006) | not stated (c006) | not stated (c005/c006) |
| West Virginia | not stated (c005) | not stated (c005) | not stated (c005) | not stated (c005/c006) | not stated (c006) | not stated (c005/c006) |
| Wisconsin | not stated (c005) | not stated (c005) | not stated (c005) | not stated (c005/c006) | not stated (c006) | not stated (c005/c006) |
| Wyoming | not stated (c005) | not stated (c005) | not stated (c005) | not stated (c005/c006) | not stated (c006) | not stated (c005/c006) |
To build a sortable working version, download the Census state tables and Quick Stats files identified by NASS (c005), then pair them with the latest ERS state data release (c006). Record the publication year, whether an ERS value is an estimate or forecast, the geographic unit, the dollar basis and the retrieval date beside every column.
Rank #3

- Comprehensive Soil Analysis: Liquid soil test kits offer a comprehensive analysis of essential soil parameters, including pH, ammonia, nitrogen, phosphorus, and potassium. Having all these measurements in one kit provides a holistic understanding of the soil's fertility and health.
- Customized Fertilizer Recommendations: With data on pH and nutrient levels, liquid soil test kits help users apply the right type and amount of fertilizers, optimizing plant growth, and preventing over-fertilization, which could harm both plants and the environment. Whether its for lawns, garden, grass, plants, vegetables, turf, flowers, compost trees vines ornamental landscape house plants or hydroponics you will be able to get the results you want.
- Time and Cost-Effective: Liquid soil test kits are relatively quick and easy to use, saving time for gardeners and agricultural professionals. Compared to sending samples to a laboratory, these kits provide rapid results, allowing for prompt action. Additionally, they are cost-effective for routine testing, making it feasible to monitor soil health regularly.
- Optimal Plant Health and Yield: By knowing the soil's pH and nutrient levels, gardeners and farmers can fine-tune their agricultural practices to create an environment conducive to optimal plant growth. Adequate levels of ammonia, nitrogen, phosphorus, and potassium are essential for healthy plant development and higher crop yields.
- Accurate and Precise Results: Liquid test kits are designed to provide accurate and precise measurements when used correctly. They are calibrated to detect specific nutrient levels, ensuring reliable data for informed decision-making in plant nutrition and soil management. You get a total of about 140 test. which is 40 test for each parameter and about 20 or so for nitrogen
Which state has the most farms?
The answer depends on the Census count, not acreage or sales. Use the “number of farms” column from the 2022 Census state table (c005) and keep the five-year Census year attached to the ranking. An annual ERS estimate should not be substituted into that structural comparison.
Outdated Drivers Are Slowing You Down
One free scan finds every outdated or missing driver and matches the right update for your exact hardware.Free scan · exact hardware matchWindows Errors? Fix Them Before They Spread
Repair common Windows errors and clear accumulated junk for a smoother, more stable PC - no reinstall needed.Free scan · no reinstallWhich states have the most farmland?
Rank states by “land in farms” acres from the 2022 Census. The Census shows farmland concentrated in the center of the country, but acreage alone does not indicate productivity or profitability. A grazing-heavy state can have more acres while generating less sales per acre than a specialty-crop state.
Independent reader supportYour contribution helps us test, update, and keep practical guides available for everyone.Where do farmers make the most money?
Use an explicitly named income measure. In its 2022 analysis, USDA ERS identified Texas, Minnesota, California, Iowa and Illinois as the five states with the highest net farm income (USDA ERS, 2022; c008). Texas’s net farm income increased 64.9% from 2021 to 2022, while Minnesota’s increased 55.7% (c008). This is a dated ranking example, not a permanent leaderboard. ERS state estimates are revised as NASS production, sales and survey inputs change; the ERS page was updated September 21, 2026, with data generally current to September 3, 2026 (c006). Use that release when making a current ranking.
Rank #4

- Professional Soil Test Kit: All soil test kits on the market can not accurately detect soil chemical elements, the soil must be sent to the laboratory to test in order to obtain accurate data; NewTest Labs to solve this pain point, after a long period of in-depth research, the development of this professional soil testing kit; beginners can also accurately detect the chemical elements in the soil
- A Total of 40 Tests for 4 Parameters Consisting of 10 Tests each for pH, Nitrogen, Phosphorus & Potassium: NewTest soil test kit for lawns can independently test pH, nitrogen, phosphorus and potassium levels in garden soil up to 10 separate times, and help us grow the healthiest vegetable
- Detailed & Easy to Understand Step-by-Step Instructions for Use: NewTest soil testing kit for gardening come with a quick guide and detailed instructions, so even beginners can follow the steps to detect accurately the desired elemental levels; With NewTest soil tester for garden nutrients you can become an expert gardener
- Easy to Read Colorimetric Results: NewTest Labs have designed specific reading methods for each soil nutrient element in order to obtain the most accurate results; just follow the steps and compare the tested test strips or liquids to the colorimetric card, you can quickly read the level range of the nutrient element and get accurate results
- Tests any Soil Type & Gardening Condition: NewTest soil nutrient test kit is suitable for all soil types of lawn & turf, vegetable gardening, flowers, compost, trees, vines, ornamental landscape, house plants, soil-less media or hydroponics; If you have any questions, please contact NewTest Labs for the perfect solution
ERS State Fact Sheets provide state-specific farm characteristics, financial indicators, leading commodities and exports for every state (c009). They are useful for explaining why a state’s sales and income ranking differs from its farm-count or acreage ranking.
Why state farm economies look so different
Corn Belt grain and oilseed scale
Central Corn Belt states tend to combine large planted areas, high grain and oilseed throughput and extensive networks of storage, processing and livestock demand. Their total receipts can be large even when margins vary with yields, prices and input costs.
Do these 3 things before closing this tab:
1Repair Windows errors before they cause bigger problems2Scan for outdated or missing drivers - takes under a minute3Clear out junk files and repair common Windows errorsGreat Plains and Western cattle and grazing
Great Plains and Western states commonly devote very large acreages to grazing and cattle. That land base lifts average farm size and can make acreage rankings look impressive, while drought, feed costs and cattle cycles drive annual income swings.
Best Value
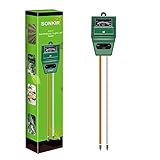
- Kindly NOTE: This soil tester can not be applied to test pH value of any other liquid. If the soil is too dry the indicator will not move, and water it before testing.
- 3 METERS IN ONE: Soil moisture level, Soil pH value and Sunlight level could be tested easily according to your need by switching the function button of this soil meter.
- NO BATTERY NEEDED: Simply insert the meter into soil, wait few minutes, accurate test results will be displayed on the readout panel. No battery is needed.
- STURDY AND SCIENTIFIC DESIGN: Reliable materials and upgraded technology used for this soil meter make it advanced and high-quality for long-term use.
- MULTIPURPOSE SOIL TEST KIT: Portable and compact design enables you to use this soil meter for house garden, farm, lawn and any other soil & plant analysis. Ideal for indoor and outdoor use.
California and specialty-crop states
California and other specialty-crop regions can produce high receipts from fruits, vegetables, nuts, nursery products and other high-value crops on fewer acres than broad-acre grain or grazing systems. Water availability, labor costs and crop-specific prices matter as much as acreage.
Dairy-intensive states
Dairy-focused states can record substantial milk receipts, but feed, energy, replacement-animal and labor expenses determine how much of those receipts becomes net income.
How to compare states without misleading yourself
- For scale: sort by total farms, land in farms or total sales, and label the 2022 Census measure.
- For typical operation size: use average acres per farm, while remembering that averages can hide very unequal distributions.
- For profitability: use ERS net farm income or net cash income, never acreage alone.
- For efficiency: calculate per-farm or per-acre measures from consistently defined columns and the same year.
- For commodity exposure: identify the leading commodity and its measure—production, sales or cash receipts—before comparing states.
- For trend work: keep the five-year Census structure series separate from annual ERS estimates and note revisions.
Why the years and series cannot simply be blended
The Census is conducted every five years, making 2022 the latest comprehensive structure snapshot used here (USDA NASS, c001). ERS income estimates are annual and revised. ERS’s broader series reports 1.88 million U.S. farms in 2024, down 8% from 2.04 million in the 2017 Census (USDA ERS, 2024; c011), but that estimate is a different series and should not be inserted into a 2022 Census table. Keep each figure’s year, definition, geography and estimate status visible whenever you publish or analyze it.
Free tools Windows power users keep installed
One-click scans. No signup required.
Quick Recap
Product prices and availability are accurate as of the date/time indicated and are subject to change. Any price and availability information displayed on Amazon at the time of purchase will apply.




