In a U.S. analysis of CarGurus listings, average asking prices for used Tesla Model Y vehicles fell 25.5% from January 2024 to January 2025, while Model 3 prices fell 25%. Those figures describe two models in a specific one-year snapshot—not every Tesla, and not depreciation from a new-car purchase price. Later U.S. snapshots found used Tesla asking prices rising, so the “last year” claim is historical rather than a description of the latest direction.
What the original “last year” claim measured
Fast Company published its report on March 4, 2025, drawing on CarGurus listing data. The comparison covered model years 2015–2023 among the 200 most common models on CarGurus and measured average asking-price changes from January 2024 to January 2025. Tesla Model S and Model X were excluded. Fast Company’s report described Tesla as having the steepest declines in that comparison.
| Included Tesla model | Average listed-price change | Period and measure |
|---|---|---|
| Model Y | −25.5% | January 2024 to January 2025; CarGurus average asking prices, as reported by Fast Company |
| Model 3 | −25% | January 2024 to January 2025; CarGurus average asking prices, as reported by Fast Company |
A decline in average listing prices does not establish that every used Tesla lost that percentage of value. It is also not the same as calculating how much a particular owner’s car depreciated from its original MSRP: that depends on the vehicle’s purchase price, age, mileage, condition, trim, and sale price.
What changed in later U.S. price snapshots
Subsequent iSeeCars comparisons showed used Tesla asking prices moving upward, rather than repeating the declines in the CarGurus window. In a comparison of September 2025 with January 2026, iSeeCars found used Tesla prices up 4.3%, while prices for the other used EVs in its comparison were down 3.6%. Executive analyst Karl Brauer said: “But Tesla pricing has proven resilient, rising while nearly every other electric vehicle price has fallen since the EV credits went away.” The figures and quotation refer to that study’s specific asking-price comparison, not a controlled explanation of why prices moved. See the iSeeCars September 2025–January 2026 comparison.
The Tool Desk
Outbyte PC Repair FREEClear out junk files and repair common Windows errorsFree Scan →Outbyte Driver Updater FREEScan for outdated or missing drivers - takes under a minuteDriver Scan →#1 Best Overall

- Made In Malaysia
A separate iSeeCars year-over-year snapshot for June 2026 reported higher listing prices for all four Tesla models it included:
| Model | Reported year-over-year listing-price change in June 2026 |
|---|---|
| Model X | +17.5% |
| Model 3 | +13.5% |
| Model S | +13.1% |
| Model Y | +12.0% |
These are later, separate snapshots, not a remeasurement of the CarGurus analysis. Different periods, samples, and methods mean the results should not be combined into a single continuous price series. Read iSeeCars’ June 2026 used-price comparison.
Rank #2

- Theme: Sport
- Toy vehicle form: Car
- Included components: Batteries
- Material: Metal
Why listing-price change is not the same as long-term depreciation
For a longer-term benchmark, iSeeCars analyzed five-year-old vehicles sold from March 2025 through February 2026. It reported average five-year depreciation of 41.8% across vehicles and 57.2% for EVs. Within its EV comparison, the Model 3’s five-year depreciation was 54.6%, below the EV average; the Model Y was 57.8%, the Model X 61.2%, and the Model S 62.0%, all above that average. See the iSeeCars five-year depreciation study.
Those age-based depreciation figures answer a different question from the 2024–2025 CarGurus result. One tracks five-year depreciation for vehicles sold during a later period; the other tracks one year of average asking-price movement for listed vehicles. Neither should be substituted for the other when estimating the value of a specific car.
Quick wins for a faster PC:
Repair Windows errors before they cause bigger problemsFix Now →Fix the driver behind crashes, sound loss and screen glitchesFind Drivers →Rank #3
![Matchbox Tesla Model 3 [Red] 04/125, 1:64 Scale Diecast Toy Vehicle](https://m.media-amazon.com/images/I/51fZ-6HLYdL._SL160_.jpg)
- Tesla Model 3 in a Deep Red Finish!
- Number 04/125 in the Overall Series!
- 1:64 Scale Diecast Toy Car
Why another country’s data can tell a different story
AutoScout24’s Switzerland marketplace data covered February 2024 to February 2025 and put used Tesla depreciation at 10.6%, compared with a 13% average across its market. That result does not disprove the U.S. CarGurus finding: the geography, vehicle sample, period, and analytical method differ. It does show why a claim about “any other brand” needs its market and comparison clearly attached. Read AutoScout24 Switzerland’s March 2025 report.
Independent reader supportYour contribution helps us test, update, and keep practical guides available for everyone.What the figures can—and cannot—tell a buyer or owner
Fast Company reported that Tesla cut new-car prices in 2024 and that those cuts dragged down resale prices. That is context offered by the report, not a controlled estimate assigning a precise share of the used-price decline to price cuts or any other cause.
Rank #4
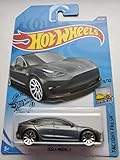
- Hot Wheels 2020 Factory Fresh Tesla Model 3, Gray 112/250
For a personal buying or selling decision, use the headline as a record of one historical market comparison, not as a forecast or a valuation formula. Compare vehicles of similar year, trim, mileage, condition, and location, and distinguish asking prices from completed sale prices. A listing-price average does not tell you what a particular car will sell for or how much an individual owner has lost.
Quick Recap
Best Value
![DieCast Hot Wheels Tesla Model 3, 174/250 [White] 2019 Green Speed 1/5](https://m.media-amazon.com/images/I/51qraYtcLuL._SL160_.jpg)
- Hot Wheels Tesla Model 3, 174/250 [White] 2019 Green Speed 1/5
Product prices and availability are accurate as of the date/time indicated and are subject to change. Any price and availability information displayed on Amazon at the time of purchase will apply.
Do these 3 things before closing this tab:
1Clear out junk files and repair common Windows errors2Scan for outdated or missing drivers - takes under a minute3Repair Windows errors before they cause bigger problems



