The Tool Desk
Outbyte PC Repair FREERepair Windows errors before they cause bigger problemsFix Now →Outbyte Driver Updater FREEFix the driver behind crashes, sound loss and screen glitchesFind Drivers →Good Excel practice starts with a dataset that is large enough to reveal patterns but structured enough that you can understand every column. The 15 datasets below cover budgeting-style analysis, sales, customers, financial statements, demographics, transactions, and beginner machine-learning exercises.
For personal-finance readers, the most useful starting points are the Financial Excel Workbook, Customer Profitability, Online Retail Transactions, and Census Table Downloads. They let you practice the same skills used in household budgeting and financial analysis: cleaning imports, calculating margins and growth, comparing categories, and building clear summaries.

15 Excel datasets worth practicing with
The list is ordered roughly from the easiest business and spreadsheet examples to larger or more analytical datasets. Most can be explored with Excel Tables, formulas, PivotTables, charts, and Power Query.
1. Olympic Sports and Medals
Source and format: Microsoft’s Excel data-model tutorial, including OlympicSports.xlsx.
#1 Best Overall

- Classic Office Apps | Includes classic desktop versions of Word, Excel, PowerPoint, and OneNote for creating documents, spreadsheets, and presentations with ease.
- Install on a Single Device | Install classic desktop Office Apps for use on a single Windows laptop, Windows desktop, MacBook, or iMac.
- Ideal for One Person | With a one-time purchase of Microsoft Office 2024, you can create, organize, and get things done.
- Consider Upgrading to Microsoft 365 | Get premium benefits with a Microsoft 365 subscription, including ongoing updates, advanced security, and access to premium versions of Word, Excel, PowerPoint, Outlook, and more, plus 1TB cloud storage per person and multi-device support for Windows, Mac, iPhone, iPad, and Android.
This is a clean introduction to grouping and summarizing records. Convert the range to a Table, then create PivotTables showing medals by country, sport, season, and medal type. It is also useful for learning how one dataset can answer several different questions without rewriting the source data.
Try: Build a PivotChart comparing gold-medal totals by country and filter it by summer or winter games.
2. Population
Source and format: Population.xlsx, supplied with Microsoft’s Olympic data-model tutorial.
Population data gives beginners practice with geographic categories and comparisons across countries or regions. You can calculate percentage differences, rank countries, and compare population totals with Olympic participation or medal counts.
Free tools Windows power users keep installed
One-click scans. No signup required.
Try: Add a calculated column for medals per million residents. Treat that result as a comparison measure, not proof that one country has a better sports system.
3. DiscImage Table
Source and format: DiscImage_table.xlsx, from the same Microsoft tutorial.
This is less about the subject matter and more about data modeling. Use it to import a second workbook, identify a shared field, and create a relationship between tables instead of repeatedly copying columns.
Try: Load both workbooks into the Data Model and inspect which field can connect them. This is a useful step toward working with separate accounts, transactions, and category tables in a personal-finance workbook.
4. Customer Profitability
Source and format: Microsoft’s Power BI sample-files page provides an .xlsx download. The sample includes revenue, costs, customer segments, high- and low-profit customers, and lifetime value.
This is one of the strongest choices for anyone interested in finance or business analysis. Calculate profit, profit margin, average customer value, and rankings. Then compare results by customer segment rather than looking only at total revenue.
Rank #2
![Microsoft Office Home & Business 2024 | Classic Desktop Apps: Word, Excel, PowerPoint, Outlook and OneNote | One-Time Purchase for 1 PC/MAC | Instant Download [PC/Mac Online Code]](https://m.media-amazon.com/images/I/41H8B5iqO4L._SL160_.jpg)
- [Ideal for One Person] — With a one-time purchase of Microsoft Office Home & Business 2024, you can create, organize, and get things done.
- [Classic Office Apps] — Includes Word, Excel, PowerPoint, Outlook and OneNote.
- [Desktop Only & Customer Support] — To install and use on one PC or Mac, on desktop only. Microsoft 365 has your back with readily available technical support through chat or phone.
Try: Use a formula such as =(Revenue-Cost)/Revenue for margin, while handling zero-revenue rows before dividing. Build a dashboard with revenue, profit, margin, and the five least-profitable customers.
5. Financial Excel Workbook
Source and format: Microsoft provides a downloadable financial workbook sample containing financial statements, KPIs, and sample reports.
This is the most direct choice for practicing spreadsheet-based financial analysis. Examine income-statement summaries, KPI cards, trends, and variance analysis. It can help you become comfortable moving from raw figures to a short management-style summary.
Try: Calculate the variance between actual and budget figures, then format unfavorable variances differently from favorable ones. Do not assume that a higher number is always better: higher expenses and lower cash balances may be unfavorable.
6. Sales and Marketing
Source and format: Microsoft’s sample-files page provides an .xlsx workbook covering sales, marketing campaigns, pipeline, conversions, and revenue.
Use this dataset to connect activity measures with financial outcomes. Compare campaign cost, leads, conversions, pipeline value, and revenue by period or channel.
Do these 3 things before closing this tab:
1Scan for outdated or missing drivers - takes under a minute2Clear out junk files and repair common Windows errors3Fix the driver behind crashes, sound loss and screen glitchesTry: Calculate conversion rate as Conversions/Leads and return on campaign spend as Revenue/Campaign Cost. Check the definitions first; a “conversion” may not mean a completed sale.
7. Supplier Quality Analysis
Source and format: Microsoft’s .xlsx supplier-quality sample.
The dataset focuses on supplier performance, defects, compliance, and quality metrics. It is a good exercise in turning counts into rates and finding recurring problems rather than simply ranking suppliers by the number of defects.
Try: Calculate defect rate as defects divided by units received. A supplier with more defects in total may simply handle much more volume than a smaller supplier.
Quick wins for a faster PC:
Clear out junk files and repair common Windows errorsFree Scan →Fix the driver behind crashes, sound loss and screen glitchesFind Drivers →Repair Windows errors before they cause bigger problemsFix Now →Rank #3

- Designed for Your Windows and Apple Devices | Install premium Office apps on your Windows laptop, desktop, MacBook or iMac. Works seamlessly across your devices for home, school, or personal productivity.
- Includes Word, Excel, PowerPoint & Outlook | Get premium versions of the essential Office apps that help you work, study, create, and stay organized.
- 1 TB Secure Cloud Storage | Store and access your documents, photos, and files from your Windows, Mac or mobile devices.
- Premium Tools Across Your Devices | Your subscription lets you work across all of your Windows, Mac, iPhone, iPad, and Android devices with apps that sync instantly through the cloud.
- Easy Digital Download with Microsoft Account | Product delivered electronically for quick setup. Sign in with your Microsoft account, redeem your code, and download your apps instantly to your Windows, Mac, iPhone, iPad, and Android devices.
8. Retail Analysis
Source and format: Microsoft’s retail-analysis .xlsx sample, covering sales, inventory, promotions, and customer behavior.
Retail data resembles many real-world financial-analysis tasks: monthly trends, product categories, store comparisons, inventory decisions, and promotion results.
Try: Create PivotTables for sales by store and product, then add a monthly line chart. Compare promoted and non-promoted sales carefully; higher sales during a promotion do not automatically mean the promotion was profitable.
9. Iris
Source and format: The UCI Iris dataset, available as downloadable data files under a CC BY 4.0 license. It contains 150 observations, four features, three flower classes, and no missing values.
Iris is not a finance dataset, but it is small enough to understand cell by cell. Use it to practice averages, filters, scatter plots, and comparisons across categories before working with larger files.
Try: Calculate average sepal and petal measurements by class and use a scatter plot to see whether two variables separate the classes.
10. Wine Quality
Source and format: UCI provides separate red- and white-wine CSV files. Together they contain 4,898 observations, 11 input features, and a quality output, with no missing values reported by UCI.
This dataset is useful for descriptive analysis and correlation questions. Compare red and white wine, summarize quality scores, and look for outliers in chemical measurements.
Try: Import both files, add a column identifying the wine type, and compare average quality by type. A relationship between two columns is not the same as a causal explanation.
11. Adult / Census Income
Source and format: The UCI Adult dataset, with 48,842 observations and 14 features. Its classification target is whether annual income exceeds $50,000.
This is a useful cleaning exercise because it contains categorical fields and missing values. Group income outcomes by education, occupation, or work class, but first profile values such as ?, blanks, and inconsistent spacing.
Try: Use COUNTIFS or a PivotTable to calculate the share above $50,000 by education level. Clearly label the result as a dataset statistic, not a prediction about an individual.
What’s actually slowing this PC down?
Pick the symptom - the matching free tool is one click away.
12. Online Retail Transactions
Source and format: The UCI Online Retail dataset, covering December 1, 2010 through December 9, 2011. The repository lists approximately 541,910 records and six features.
This is excellent practice for transaction analysis. Create revenue from quantity and unit price, summarize sales by month and country, identify repeat customers, and use PivotTables to find strong or weak products.
Try: Add Revenue = Quantity*UnitPrice, then inspect negative quantities and cancellations before treating total revenue as final sales. With roughly 542,000 records, avoid copying formulas across unnecessarily large ranges; use a Table and PivotTables.
13. Titanic Passenger Survival
Source and format: The common Kaggle version contains train.csv with 891 passengers, test.csv with 418 passengers, and gender_submission.csv.
Recommended Free Tools
This dataset is widely used for beginner analysis because the columns are understandable: sex, age, passenger class, fare, and embarkation port. Use the training file for ordinary descriptive analysis because it contains the Survived field.
Try: Create survival-rate PivotTables by sex and passenger class. Do not combine the test file with the training file to calculate a survival rate: the test file does not include actual survival labels.
14. Social Security Baby Names
Source and format: The Social Security Administration national baby-name dataset is listed on Data.gov and includes a ZIP download. It begins in 1880 and contains name, year of birth, sex, and count.
This is a simple way to practice time-series analysis. Track a name’s count or rank over time, compare names by sex, and group years into decades.
Windows Errors? Fix Them Before They Spread
Repair common Windows errors and clear accumulated junk for a smoother, more stable PC - no reinstall needed.Free scan · no reinstallCrashes, No Sound, or Screen Glitches?
Random freezes, missing sound and display glitches usually trace back to one bad driver. Find and replace yours safely.Free scan · under a minuteBest Value
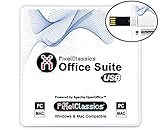
- Fully compatible with Microsoft Office documents, Office Suite is the number 1 affordable alternative. It is compatible with Word, Excel and PowerPoint files allowing you to create, open, edit and save all your existing documents in an easy-to-use professional office suite. Suitable for home, student, school, family, personal and business use, it includes comprehensive PDF user guides to help you get started, plus a dedicated guide for university students to help with their studies. Multilingual - English, Spanish (Español) and more languages supported.
- Professional premier office suite includes word processor, spreadsheet, presentation, graphics, database and math apps! It can open a plethora of file formats including doc, docx, odt, txt, xls, xlsx, xlsm, ppt, pptx and many more, making it the only office suite you will ever need. You can use the ‘Save as’ feature to ensure your files remain compatible with Word, Excel and PowerPoint, plus you can convert and export your documents to PDF with ease.
- Full program included that will never expire! Free for life updates with lifetime license so no yearly subscription or key code required ever again! Unlimited users allow you to install to both desktop and laptop without any additional cost, and everything you need is provided on USB; perfect for offline installation, reinstallation and to keep as a backup. Compatible with Microsoft Windows 11, 10, 8.1, 8, 7, Vista, XP (32/64-bit), Mac OS X and macOS.
- PixelClassics exclusive extras include 1500 fonts, 120 professional templates, 1000's of clip art images, PDF user guides, over 40 language packs, easy-to-use PixelClassics installation menu (PC only), email support and more! Each USB comes complete with our quick start install guide, plus a fully comprehensive PDF guide is provided on USB.
- You will receive the USB (not a disc) exactly as pictured, in protective sleeve (retail box not included). Our slimline USB is 100% compatible with ALL standard size USB ports. To ensure you receive exactly as advertised including all our exclusive extras, please choose PixelClassics. All our USBs are checked and scanned 100% virus and malware free giving you peace of mind and hassle-free installation, and all of this is backed up by PixelClassics friendly and dedicated email support.
Try: Import the yearly files into one Table, add a decade column with =INT(Year/10)*10, and chart the trend. Remember that counts and rankings answer different questions: a name can rise in rank even while its absolute count falls.
15. Census Table Downloads
Source and format: Data.census.gov allows tables to be downloaded in Excel, CSV, and ZIP formats.
Choose a manageable table about population, age, income, or housing, then compare locations or years. This is particularly relevant to personal finance because local income, housing, and demographic figures provide context for affordability and spending decisions.
Excel downloads include an Information worksheet and a Data worksheet. Keep both. The Information sheet contains the table name, universe, source, citation, and notes that explain what the figures actually measure.
What’s actually slowing this PC down?
Pick the symptom - the matching free tool is one click away.
How to bring a dataset into Excel safely
Import a CSV or text file
- Open Excel and select Data > Get Data > From File > From Text/CSV. Some Windows builds show Data > Get & Transform Data > Get Data > From File > From Text/CSV.
- Choose the file and inspect the preview. Confirm the delimiter, file origin, and apparent data types.
- Select Load for a new worksheet, or Load To to choose a worksheet, PivotTable/PivotChart, Data Model, or connection-only import.
- Choose Transform Data when you need to clean values in Power Query before loading them.
Import another Excel workbook
- Select Data > Get Data > From File > From Excel Workbook.
- Choose the workbook.
- In the Navigator, select the relevant worksheet, Table, or named range.
- Choose Load or Transform Data.
Turn a range into an Excel Table
- Select any cell in the dataset.
- Choose Home > Format as Table.
- Confirm My table has headers.
- Rename the Table under Table Design > Properties > Table Name.
Tables expand when rows are added and make formulas, filters, and PivotTables easier to maintain. Use descriptive names such as tblTransactions rather than leaving the default name Table1.
Common problems when using these datasets
| Problem | What to do |
|---|---|
| Leading zeros disappear from ZIP codes or IDs | Import through the Text/CSV connector and set the column to Text. Do not open the CSV directly by double-clicking it. |
| Dates are interpreted incorrectly | Check the detected locale and data type in Power Query. Confirm a few dates against the source documentation. |
| Characters appear garbled | In the import preview, select the correct file origin, usually UTF-8. A UTF-8 file with a byte-order mark generally opens more cleanly. |
| Columns are split incorrectly | Check whether the file uses commas, semicolons, tabs, or pipes as delimiters. |
| The workbook becomes slow | Use Power Query, Tables, and PivotTables. Avoid volatile formulas and repeated full-column calculations, particularly with Online Retail. |
| You cannot load all rows to a worksheet | Excel worksheets are limited to 1,048,576 rows and 16,384 columns. Power Query can process more data, but a worksheet still cannot display more than the row limit. |
| A dataset contains missing categories | Profile blanks and markers such as ? before calculating rates. Decide whether to exclude, replace, or separately report them. |
| A Microsoft sample looks too polished | Some Power BI samples use fictitious or illustrative data and may have attribution or copyright requirements. Read the source page before republishing the workbook. |
Which dataset should you choose first?
Choose based on the skill you want to build:
| Goal | Best starting dataset |
|---|---|
| Learn Tables and PivotTables | Olympic Sports and Medals |
| Practice margins and KPIs | Customer Profitability or Financial Excel Workbook |
| Analyze transactions | Online Retail Transactions |
| Practice cleaning messy categories | Adult / Census Income |
| Build time-series charts | Social Security Baby Names or Census Table Downloads |
| Learn relationships between tables | Microsoft’s Olympic data-model files |
| Try beginner predictive analysis | Titanic or Iris |
For a personal-finance project, start with a small dataset and complete the full workflow: document the source, import it safely, clean the columns, create calculated fields, summarize the results, and write three findings. That process is more valuable than downloading a large file and producing a chart without checking what the numbers mean.
FAQ
What is the easiest Excel dataset for a beginner?
The Olympic Sports and Medals dataset is a good first choice because its categories are easy to understand and it works well with Tables, filters, PivotTables, and charts. Iris is another small option with only 150 observations and no missing values.
Which dataset is best for practicing financial analysis in Excel?
Start with Microsoft’s Financial Excel Workbook for statements, KPIs, and variance analysis. Customer Profitability is useful when you want to practice revenue, costs, margins, customer rankings, and lifetime value.
Can Excel handle the Online Retail dataset?
Yes. The dataset has approximately 541,910 records, below Excel’s worksheet limit of 1,048,576 rows, but it can still make formula-heavy workbooks slow. Import it with Power Query and use an Excel Table and PivotTables rather than repeatedly copying formulas.
Why should I avoid opening a CSV by double-clicking it?
Excel may infer dates, remove leading zeros, choose the wrong delimiter, or display UTF-8 characters incorrectly. Use Data > Get Data > From File > From Text/CSV so you can check the file origin, delimiter, and column types before loading it.
The Bottom Line
The best beginner dataset is not necessarily the largest or most impressive one. Pick a file that matches the skill you want to practice, preserve the source notes, import it through Excel’s data tools, and verify the columns before calculating results. For finance-focused practice, the Financial Excel Workbook, Customer Profitability, Online Retail, and Census downloads offer the clearest path from raw data to useful analysis.
Quick Recap
Product prices and availability are accurate as of the date/time indicated and are subject to change. Any price and availability information displayed on Amazon at the time of purchase will apply.
The Tool Desk
Outbyte PC Repair FREEClear out junk files and repair common Windows errorsFree Scan →Outbyte Driver Updater FREEFix the driver behind crashes, sound loss and screen glitchesFind Drivers →



