There is no single official or fully fair ranking of the U.S. budget deficit by president. The federal government records deficits by fiscal year, while presidents take office in January and Congress controls taxation, borrowing, appropriations, and most changes to mandatory spending.
The latest completed fiscal year is FY2025. Treasury reported approximately $5.235 trillion in receipts, $7.010 trillion in outlays, and a $1.775 trillion unified-budget deficit. CBO reported the deficit at approximately 5.8% of GDP. FY2026 is not complete as of August 10, 2026: CBO reported about $1.4 trillion in borrowing through the first nine months and projected a full-year deficit of roughly $1.9 trillion. That projection is not an actual annual result.
As an Amazon Associate I earn from qualifying purchases.
The most defensible comparison uses three measures together: annual fiscal-year deficits, deficits as a percentage of GDP, and cumulative results during fiscal years ending while each president was in office. None of those measures, by itself, proves that a president personally caused the deficit.
The key caveat: the government does not keep an official deficit total by president
Government budget data are organized by fiscal year, not by presidential term. Since FY1977, the federal fiscal year has run from October 1 through September 30 and is named for the year in which it ends. FY2025, for example, ran from October 1, 2024, through September 30, 2025.
#1 Best Overall

- Mr. Pen 12-digit calculator is perfect for completing basic numerical calculations, making it ideal for office, primary school, market, or even home use. It features big, sensitive keys that are easy to press down and offer quick data entry.
- The mechanical switch buttons offer a responsive and satisfying click with each press, similar to a mechanical keyboard, improving the overall user experience and precision of data entry. Equipped with essential functions like memory recall, percentage calculation, and more, it meets a variety of computational needs.
- Mr. Pen calculator is portable and small in size at 6.2 x 4.4 inches, so it doesn't take up much desk space but is still comfortably sized for easy usage. It also has a large 12-digit display, increasing its visibility from any angle.
- Operating on just one AAA battery (not included), this calculator is designed with an automatic shutdown feature that activates after 10 minutes of inactivity, conserving battery life and ensuring longevity.
- Mr. Pen calculator is the perfect tool for quickly dealing with everyday calculation problems in various settings such as schools, offices, or even at home! It offers a fast, efficient, and user-friendly experience that makes it an ideal choice for anyone looking for a reliable calculator.
Presidents take office on January 20. As a result, most fiscal years include more than one administration, and the policies affecting a fiscal year may have been enacted years earlier. Congress also has the constitutional power of the purse. It passes tax laws, appropriations, borrowing authority, reconciliation legislation, continuing resolutions, and emergency supplemental spending. The president proposes a budget, negotiates, signs or vetoes legislation, and administers the resulting laws, but cannot unilaterally set the federal deficit. The Congressional Research Service explains the distinction between the president’s budget request and Congress’s budget process.
That is why the phrase deficit by president can mean several different things:
- the deficit in each fiscal year that ended while a president was in office;
- the sum of those annual deficits and surpluses;
- the year-over-year change in the deficit;
- the deficit relative to GDP;
- or the budgetary effect of legislation and executive actions compared with a defined baseline.
Those are different questions. A responsible comparison should not collapse them into one ranking.
Do these 3 things before closing this tab:
1Scan for outdated or missing drivers - takes under a minute2Clear out junk files and repair common Windows errors3Fix the driver behind crashes, sound loss and screen glitchesLatest completed result: FY2025
| Measure | FY2025 result |
|---|---|
| Fiscal-year dates | October 1, 2024–September 30, 2025 |
| Receipts | Approximately $5.235 trillion |
| Outlays | Approximately $7.010 trillion |
| Unified-budget deficit | Approximately $1.775 trillion |
| Deficit as a share of GDP | Approximately 5.8% |
| President at the end of the fiscal year | Donald Trump, who took office on January 20, 2025 |
Treasury’s FY2025 Combined Statement reports the receipts, outlays, and deficit. CBO’s FY2025 budget review provides a separate official presentation. Small differences between these publications can result from rounding, revisions, timing adjustments, and accounting conventions.
FY2025 is a transition year. It began during Joe Biden’s presidency and ended during Donald Trump’s second presidency. Assigning the whole year to either president is a presentation convention, not a statement that one president caused every dollar of the result.
Deficit, surplus, debt, and budget: the terms that matter
Federal budget deficit
The federal budget deficit is the amount by which federal outlays exceed federal receipts during one fiscal year:
Deficit = Outlays − Receipts
When receipts exceed outlays, the government records a surplus. OMB and FRED often use the sign convention Federal Surplus or Deficit [-], where a negative number means a deficit and a positive number means a surplus. The tables below reverse that presentation for readability: deficits appear as positive numbers, while surpluses appear in parentheses.
Outdated Drivers Are Slowing You Down
One free scan finds every outdated or missing driver and matches the right update for your exact hardware.Free scan · exact hardware matchWindows Errors? Fix Them Before They Spread
Repair common Windows errors and clear accumulated junk for a smoother, more stable PC - no reinstall needed.Free scan · no reinstallFederal debt
The deficit is a one-year flow. Federal debt is an accumulated stock of borrowing. Debt reflects past deficits, less past surpluses, plus other adjustments such as certain timing and financing transactions.
A president can oversee a falling annual deficit while the debt balance continues to rise. If the government runs a $1 trillion deficit instead of a $2 trillion deficit, borrowing has fallen but the debt has still increased by roughly $1 trillion, before other adjustments. Deficit, debt, and national debt should not be used interchangeably.
Receipts and outlays
Receipts are federal revenues, including individual and corporate income taxes, payroll taxes, customs duties, and other collections. Outlays are payments made by the federal government. The annual deficit table uses budget receipts and outlays rather than the accrual-based net operating cost shown in federal financial statements.
Unified and on-budget figures
The figures used here are unified-budget results, which combine on-budget and off-budget activity. An on-budget number is narrower and should not be substituted into a unified-budget comparison. The distinction is especially important when comparing figures from different reports or attempting to explain Social Security and other trust-fund activity.
Free tools Windows power users keep installed
One-click scans. No signup required.
Cash-based budget results versus accrual financial statements
The federal budget generally reports receipts and outlays using a modified cash basis. Treasury’s Financial Report also contains accrual-based financial statements, including measures such as net operating cost. Those measures answer different accounting questions. Do not insert an accrual-based financial-statement figure into a historical budget-deficit table.
Annual U.S. deficits and surpluses, FY1981–FY2025
The following table uses the OMB-sourced FRED annual federal surplus-or-deficit series. Amounts are nominal dollars in billions and are rounded to one decimal place. Parentheses indicate surpluses.
Show the annual deficit and surplus table
| Fiscal year | Deficit or surplus |
|---|---|
| 1981 | $79.0 billion deficit |
| 1982 | $128.0 billion deficit |
| 1983 | $207.8 billion deficit |
| 1984 | $185.4 billion deficit |
| 1985 | $212.3 billion deficit |
| 1986 | $221.2 billion deficit |
| 1987 | $149.7 billion deficit |
| 1988 | $155.2 billion deficit |
| 1989 | $152.6 billion deficit |
| 1990 | $221.0 billion deficit |
| 1991 | $269.2 billion deficit |
| 1992 | $290.3 billion deficit |
| 1993 | $255.1 billion deficit |
| 1994 | $203.2 billion deficit |
| 1995 | $164.0 billion deficit |
| 1996 | $107.4 billion deficit |
| 1997 | $21.9 billion deficit |
| 1998 | ($69.3 billion) surplus |
| 1999 | ($125.6 billion) surplus |
| 2000 | ($236.2 billion) surplus |
| 2001 | ($128.2 billion) surplus |
| 2002 | $157.8 billion deficit |
| 2003 | $377.6 billion deficit |
| 2004 | $412.7 billion deficit |
| 2005 | $318.3 billion deficit |
| 2006 | $248.2 billion deficit |
| 2007 | $160.7 billion deficit |
| 2008 | $458.6 billion deficit |
| 2009 | $1,412.7 billion deficit |
| 2010 | $1,294.4 billion deficit |
| 2011 | $1,299.6 billion deficit |
| 2012 | $1,076.6 billion deficit |
| 2013 | $679.8 billion deficit |
| 2014 | $484.8 billion deficit |
| 2015 | $442.0 billion deficit |
| 2016 | $584.7 billion deficit |
| 2017 | $665.5 billion deficit |
| 2018 | $779.1 billion deficit |
| 2019 | $983.6 billion deficit |
| 2020 | $3,095.7 billion deficit |
| 2021 | $2,773.6 billion deficit |
| 2022 | $1,374.2 billion deficit |
| 2023 | $1,687.5 billion deficit |
| 2024 | $1,815.4 billion deficit |
| 2025 | $1,774.7 billion deficit |
For the government’s longer historical record, OMB Historical Table 1.1 covers annual receipts, outlays, and surpluses or deficits from 1789 through FY2025. OMB Table 1.2 provides GDP-normalized data from 1930 through FY2025, and the historical tables also provide constant-dollar comparisons.
Rank #2

- Fundamental, two-line calculator that combines statistics and advanced scientific functions for high school math and science
- Two-line display shows the entry and calculated result at the same time for easy understanding of the calculation
- Fraction features, conversions, and basic scientific and trigonometric functions
- Solar and battery powered
- Approved for use on SAT, ACT and AP exams
What the annual record shows
FY2020 was the largest nominal deficit in the modern series
The FY2020 deficit was approximately $3.096 trillion, followed by approximately $2.774 trillion in FY2021. The COVID-19 pandemic produced an unusual combination of emergency legislation, automatic stabilizers, reduced receipts, and exceptionally high outlays. These were emergency-era results, not ordinary peacetime budget outcomes.
FY2020 was also enormous relative to the economy, at approximately 14.5% of GDP. The dollar record and the GDP-normalized record are different measures.
FY1943 was the largest deficit relative to GDP
In the OMB/FRED GDP series, the FY1943 deficit was approximately 26.9% of GDP. World War II mobilization drove spending to extraordinary levels. A comparison that uses only nominal dollars would miss the fiscal scale of that period. The OMB/FRED deficit-to-GDP series is the appropriate source for this comparison.
The 1990s produced a sequence of surpluses
The federal government recorded surpluses in FY1998, FY1999, FY2000, and FY2001. Strong economic growth, rising receipts, budget legislation, and spending conditions all contributed. The sequence should not be assigned entirely to one president or one branch of government.
FY2001 ran from October 1, 2000, through September 30, 2001. It therefore included the final months of Bill Clinton’s presidency and most of George W. Bush’s first year. Calling the entire FY2001 surplus either Clinton’s or Bush’s result is misleading.
The Tool Desk
Outbyte PC Repair FREERepair Windows errors before they cause bigger problemsFix Now →Outbyte Driver Updater FREEScan for outdated or missing drivers - takes under a minuteDriver Scan →Deficit reduction does not mean a balanced budget
A deficit can shrink without disappearing. The deficit fell from $1.413 trillion in FY2009 to $584.7 billion in FY2016, but every year in that period still recorded a deficit. Similarly, the decrease from $2.774 trillion in FY2021 to $1.374 trillion in FY2022 was a reduction of approximately $1.399 trillion, but FY2022 still ended with a large deficit.
Use reduced the deficit for a year-over-year decline. Reserve balanced the budget for a year in which receipts approximately equaled outlays, and use ran a surplus when receipts exceeded outlays.
Comparing presidents using fiscal years ending during their terms
The table below groups fiscal years according to the president in office at the end of the fiscal year. That is a clear and reproducible presentation rule, but it is not a causal attribution. Cumulative figures sum the annual data above, treating surpluses as negative deficits. The averages are arithmetic averages of the counted fiscal years; deficit-to-GDP figures are approximate averages of the annual GDP ratios, not a claim that the president caused that share of GDP.
| President | Fiscal years counted | Cumulative net result | Average annual result | Average annual deficit or surplus as share of GDP |
|---|---|---|---|---|
| Ronald Reagan | FY1981–FY1988 | $1.339 trillion deficit | $167.3 billion deficit | Approximately 4.1% |
| George H. W. Bush | FY1989–FY1992 | $933.1 billion deficit | $233.3 billion deficit | Approximately 3.8% |
| Bill Clinton | FY1993–FY2000 | $320.5 billion deficit | $40.1 billion deficit | Approximately 0.7% |
| George W. Bush | FY2001–FY2008 | $2.006 trillion deficit | $250.7 billion deficit | Approximately 1.9% |
| Barack Obama | FY2009–FY2016 | $7.275 trillion deficit | $909.3 billion deficit | Approximately 5.8% |
| Donald Trump, first term | FY2017–FY2020 | $5.524 trillion deficit | $1.381 trillion deficit | Approximately 6.6% |
| Joe Biden | FY2021–FY2024 | $7.651 trillion deficit | $1.913 trillion deficit | Approximately 7.5% |
| Donald Trump, second term | FY2025 only | $1.775 trillion deficit | Not comparable: one transition year | Approximately 5.8% |
Important calculation note: The cumulative and average-dollar figures in this table are recalculated from the displayed OMB/FRED annual series. They are nominal, not inflation-adjusted, and they are not estimates of deficits personally caused by each president.
What’s actually slowing this PC down?
Pick the symptom - the matching free tool is one click away.
Under this end-of-fiscal-year convention, Joe Biden has the largest cumulative result among the four-year windows shown, followed by Barack Obama. That observation is not a meaningful ranking of presidential responsibility: Biden’s window includes the FY2021 pandemic-era deficit, Obama’s begins with the financial crisis, and the windows include different economic conditions, laws, interest costs, and transition-year timing.
Why different comparison methods produce different winners
1. Largest annual deficit in dollars
This measure asks which fiscal year had the largest nominal shortfall. In the annual series above, the answer is FY2020, at approximately $3.096 trillion. Grouping by the president in office at the end of that year places FY2020 in Donald Trump’s first-term column.
That does not mean the president personally caused $3.096 trillion of deficit. The result reflected a global pandemic, emergency legislation, automatic stabilizers, reduced revenue, and spending decisions involving Congress and prior law.
2. Largest deficit as a share of GDP
This measure asks how large the deficit was relative to the economy’s capacity to support it:
Deficit as a percentage of GDP = Deficit ÷ GDP × 100
Rank #3

- 【12 Digit Display】Features easy-to-read 12 digits LCD display, the big screen clearly shows the numbers, suitable for all kinds of calculations and office scenes.
- 【Double Power Supply】Support both solar energy and batteries. Our calculator comes with an AAA battery; In a well-lit environment, you can also use solar energy to charge.
- 【Embedded Big Button】Big buttons make your input flow and comfortable; Raised button design makes your input accurate and fast; Sturdy plastic keys for long-lasting use.
- 【Automatic Shut-down】Intelligent power saving design-Our calculator can stand by for 8 minutes without operation, then it will automatically shut down.
- 【Function introduction】Contains basic functions of add, subtract, multiply, divide,CE, %; Upgrade function of M+/M-/MRC; Covers the needs of daily computing.
GDP normalization is essential across decades. A $100 billion deficit in 1980 and a $100 billion deficit today do not represent the same economic burden. The highest result in the supplied historical GDP series is FY1943, at approximately 26.9% of GDP. FY2020 was approximately 14.5%, while FY2025 was approximately 5.8%.
3. Cumulative deficit during a presidency
This measure adds the annual results for fiscal years ending while a president was in office. It is useful for describing what happened during that period, but it includes inherited budgets, automatic spending, economic shocks, congressional action, emergency measures, and fiscal years crossing two administrations.
It should be labeled cumulative deficit during fiscal years ending while the president was in office, not deficits caused by the president.
4. Change from the inherited deficit
A first-to-last comparison can show whether the annual shortfall was higher or lower at the end of a term, but it is highly sensitive to the starting date. A president inherits an economy, enacted laws, scheduled tax provisions, debt-service obligations, and often a budget already operating under a continuing resolution.
The better approach is to identify the exact fiscal years, show the transition year separately, and explain whether a recession, war, financial rescue, natural disaster, or pandemic affected the comparison.
5. Policy-attributable budgetary effects
This is a different analysis. It asks how enacted legislation or executive actions changed projected deficits relative to a specified baseline over a specified period. It requires cost estimates from sources such as CBO and the Joint Committee on Taxation. A 10-year score of a law is not the same thing as adding up Treasury’s annual deficits.
Recent Brookings fiscal analysis illustrates this policy-attribution approach. It can supplement the annual outcome series, but it should not replace it. A president’s budget request should never be treated as enacted law merely because it contains a projected deficit.
Quick wins for a faster PC:
Fix the driver behind crashes, sound loss and screen glitchesFind Drivers →Clear out junk files and repair common Windows errorsFree Scan →Scan for outdated or missing drivers - takes under a minuteDriver Scan →Transition years: why the first year is especially misleading
Four modern transition years deserve special attention, along with FY1981 and FY2025:
| Fiscal year | Presidential transition | Why assignment is difficult |
|---|---|---|
| FY1981 | Jimmy Carter to Ronald Reagan | The fiscal year began before Reagan took office and ended during his first year. |
| FY2001 | Bill Clinton to George W. Bush | The fiscal year included the final months of Clinton’s presidency and most of Bush’s first year; it ended with a surplus. |
| FY2009 | George W. Bush to Barack Obama | The fiscal year began under Bush and ended under Obama, during the financial crisis and emergency response. |
| FY2021 | Donald Trump to Joe Biden | The fiscal year began under Trump and ended under Biden, while pandemic-related programs continued to affect receipts and outlays. |
| FY2025 | Joe Biden to Donald Trump | The fiscal year began under Biden and ended under Trump; Treasury recorded the full-year result, not a presidentially separated total. |
The Congressional Research Service notes that incoming presidents often do not submit a normal budget for the first fiscal year of their term. The outgoing president’s budget request, existing appropriations, continuing resolutions, and previously enacted mandatory programs can remain influential.
For a more serious attribution study, analysts can show the last completed fiscal year before inauguration, the first fiscal year ending during the term, and the first fiscal year beginning after the administration took office. Even then, the dates do not isolate responsibility perfectly.
What presidents can influence—and what they cannot control alone
The president can influence
- the administration’s budget request and policy priorities;
- negotiations with Congress;
- whether to sign or veto enacted legislation;
- executive implementation of laws and agency management;
- some executive actions, subject to statutory authority, judicial review, and administrative constraints;
- the timing and design of proposals that Congress may later enact.
Congress controls major parts of the budget process
- tax legislation;
- borrowing authority and the debt limit;
- annual discretionary appropriations;
- changes to mandatory programs through legislation;
- reconciliation legislation;
- continuing resolutions when regular appropriations are not enacted;
- emergency supplemental appropriations.
Mandatory spending generally follows eligibility rules and benefit formulas established in authorizing law. Discretionary spending is provided through annual appropriations. Net interest is the cost of servicing accumulated federal debt and is driven by the debt balance, interest rates, and the composition of outstanding obligations. These categories change over time, so there is no single fixed mandatory-versus-discretionary percentage that can fairly describe every president’s term.
Recommended Free Tools
For personal-finance readers, the practical point is that an annual deficit ranking cannot tell you by itself whether taxes, interest rates, inflation, or household borrowing costs will rise. It does show how much the federal government borrowed during a year, while the longer-term debt and interest burden help shape future policy choices.
Historical turning points
World War II
World War II produced extraordinary deficits relative to the economy. FY1943’s approximately 26.9% deficit-to-GDP ratio is why a chart covering the full historical period should include GDP-normalized figures, not just nominal dollars.
The 1976 fiscal-year transition
Before FY1977, the federal fiscal year ran from July 1 through June 30. The three-month period from July 1 through September 30, 1976, was a separate transition quarter. From FY1977 onward, the fiscal year ran from October 1 through September 30.
Rank #4
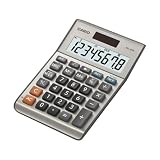
- LARGE EIGHT-DIGIT DISPLAY – Clear and easy-to-read 8-digit display, perfect for everyday calculations and ensuring accurate results in home or office settings.
- TAX & CURRENCY EXCHANGE FUNCTIONS – Effortlessly handle tax calculations and convert home currency to other currencies for easy financial management.
- GENERAL PURPOSE CALCULATOR – Ideal for a wide range of applications, from basic math to business and personal use, with memory keys for quick storage and recall.
- USER-FRIENDLY KEYBOARD – Easy-to-use layout, featuring square root, percent calculation, and simple functions that make it perfect for everyday tasks.
- COMPACT & PORTABLE DESIGN – Space-saving design that fits easily on any desk or in a briefcase, making it ideal for both home and office use.
FY1976 and the transition quarter should not be treated as ordinary 12-month fiscal years without explanation. The GAO budget glossary documents the change.
The 1970s and early 1980s
Comparisons across this period are affected by the fiscal-calendar change, inflation, recession effects, and the changing size of the economy. Nominal-dollar totals alone are particularly weak measures across this period.
The 1990s
The late-1990s surpluses reflected a combination of economic growth, rising receipts, budget legislation, and spending conditions. They were not the product of a president acting alone. Congress enacted the relevant tax and spending laws, while the administration proposed priorities and participated in negotiations.
2001 through 2008
The federal government moved from surplus to deficit during this period. Relevant factors included tax legislation, defense and homeland-security spending, the wars in Afghanistan and Iraq, Medicare prescription-drug legislation, and the financial crisis developing near the end of the period. FY2001 itself was a transition-year surplus and should not be assigned entirely to either Clinton or George W. Bush.
2009 through 2016
Deficits were exceptionally high after the financial crisis and then declined over the following years. The annual series distinguishes a crisis-era peak from later deficit reduction. Recession effects, emergency programs, economic recovery, tax receipts, spending controls, and the timing of policy implementation all mattered.
Free tools Windows power users keep installed
One-click scans. No signup required.
It is accurate to say that the annual deficit declined over much of this period. It is not accurate to treat the entire decline or the entire deficit as the personal result of one president.
2017 through 2021
The pre-pandemic deficit trend should be separated from the COVID-19 shock. FY2020 and FY2021 should be marked as emergency years in any chart. FY2021 is also a Trump-to-Biden transition year, making presidential assignment especially problematic.
2022 through 2025
The post-pandemic years included changing receipts and outlays, inflation, the unwinding or continuation of emergency programs, interest-rate effects, and accounting effects related to student-loan policy. Annual deficits remained large even after the FY2020 peak.
Net interest has become a more important part of the story. CBO’s FY2025 materials put net interest at roughly $1 trillion and about 3.2% of GDP under one presentation, while noting that its share was more than twice the 2021 level. Interest is largely a consequence of accumulated debt and interest rates, not simply a new discretionary decision made in the current fiscal year. See CBO’s FY2025 budget infographic and discussion.
What’s actually slowing this PC down?
Pick the symptom - the matching free tool is one click away.
What the president inherited: a better attribution framework
Instead of asking only which president had the largest deficit, examine four separate layers:
- Starting conditions: the last completed fiscal year, the monthly deficit trend, economic growth, unemployment, inflation, and interest rates before inauguration.
- Already-enacted commitments: mandatory spending formulas, tax provisions, appropriations, debt-service obligations, and emergency programs already in law.
- New decisions: legislation signed into law, vetoes, negotiated appropriations, supplemental spending, and executive actions with measurable fiscal effects.
- External conditions: recessions, wars, pandemics, natural disasters, financial rescues, and other events that change receipts or outlays.
The last completed fiscal year before inauguration is useful context, but it is not automatically the deficit that a president inherited on January 20. Fiscal years and presidential terms do not line up, and a fiscal year can change sharply after inauguration for reasons that were already in motion.
How to read the latest FY2026 numbers
| Measure | Status as of August 10, 2026 |
|---|---|
| FY2025 | Actual completed year: approximately $1.775 trillion deficit and 5.8% of GDP |
| FY2026 year to date | Approximately $1.4 trillion deficit through the first nine months, according to CBO’s June review |
| FY2026 full-year outlook | Approximately $1.9 trillion CBO projection, not an actual result |
| FY2026 end date | September 30, 2026 |
Use CBO’s June 2026 Monthly Budget Review for the year-to-date figure and CBO’s 2026–2036 Budget and Economic Outlook for the projection. The final FY2026 actual result will not be available until after September 30, 2026, followed by Treasury reporting and possible revisions.
Do not place the $1.9 trillion projection in the historical actuals table. Put it in a separate outlook box and label it clearly as a CBO projection.
The Tool Desk
Outbyte Driver Updater FREEFix the driver behind crashes, sound loss and screen glitchesFind Drivers →Outbyte PC Repair FREEClear out junk files and repair common Windows errorsFree Scan →Why Treasury, CBO, OMB, and FRED can differ slightly
Different official sources can publish slightly different values for the same completed fiscal year. Common reasons include:
Best Value

- 8-digit LCD provides sharp, brightly lit output for effortless viewing
- 6 functions including addition, subtraction, multiplication, division, percentage, square root, and more
- User-friendly buttons that are comfortable, durable, and well marked for easy use by all ages, including kids
- Designed to sit flat on a desk, countertop, or table for convenient access
- rounding and the use of unrounded underlying figures;
- later agency reconciliations and revisions;
- timing adjustments for payments shifted by weekends or holidays;
- different accounting conventions;
- the distinction between budget reporting and accrual-based financial statements;
- different publication vintages.
For a historical comparison, choose one consistent annual series. The OMB/FRED series is used for the annual table here. Treasury’s Combined Statement is used to validate the latest completed year. CBO sometimes uses timing-adjusted analytical series; do not mix those values with unadjusted Treasury or OMB actuals without explaining the difference.
A practical method for ranking presidents responsibly
- Define the question. Decide whether you are measuring annual outcomes, cumulative deficits, deficit-to-GDP ratios, changes from a starting year, or policy-attributable effects.
- Use fiscal years. Do not convert a January inauguration into an invented calendar-year deficit.
- Mark transition years. At minimum, identify FY1981, FY2001, FY2009, FY2021, and FY2025.
- Include surpluses. Subtract them from cumulative deficits or display them as a separate category.
- Show GDP-normalized data. For comparisons across decades, use deficit as a percentage of GDP and, when appropriate, constant-dollar values.
- Separate emergencies. Mark wars, recessions, financial rescues, natural disasters, and COVID-19 years rather than treating them as ordinary fiscal performance.
- Separate actuals from proposals and projections. A president’s budget request is not enacted law, and a CBO projection is not an actual Treasury result.
- Use policy scores for policy claims. Cite CBO or Joint Committee on Taxation estimates, identify the baseline and scoring window, and distinguish legislation from executive action.
Bottom line for personal-finance readers
The annual deficit tells you how much the federal government added to its borrowing during a fiscal year. It does not tell you, by itself, how much a president caused.
The cleanest answer to which president had the largest deficit? is therefore conditional: FY2020 had the largest nominal annual deficit in the modern OMB/FRED series, at about $3.096 trillion, and that fiscal year ended during Donald Trump’s first term. The largest deficit relative to GDP was FY1943, at about 26.9% of GDP. Those are statements about measured fiscal-year outcomes, not complete judgments about presidential responsibility.
Recommended Free Tools
For accountability, use the three-layer model: what happened in the annual data, who was in office during each portion of the fiscal year, and which enacted policies or external conditions can reasonably explain the result.
Frequently Asked Questions
Which president had the largest U.S. budget deficit?
The largest nominal annual deficit in the OMB/FRED series through FY2025 occurred in FY2020, at approximately $3.096 trillion. FY2020 ended during Donald Trump’s first term, but the result reflected the COVID-19 emergency, congressional legislation, automatic stabilizers, reduced receipts, and unusually high outlays. It should not be described as a deficit personally caused by the president.
Which presidents had budget surpluses?
The federal government recorded surpluses in FY1998, FY1999, FY2000, and FY2001. The first three were during Bill Clinton’s presidency, while FY2001 crossed from Clinton to George W. Bush. Because FY2001 ended during Bush’s first year but began before he took office, it should be labeled a transition-year surplus rather than assigned entirely to either president.
Which president reduced the deficit the most?
The answer depends on the measure. In the annual FY1981–FY2025 table, the largest single-year nominal decline was from FY2021 to FY2022, when the deficit fell by approximately $1.399 trillion. That reduction followed the pandemic-era peak and does not isolate presidential policy. A term-to-term, GDP-based, or policy-scored comparison could produce a different answer.
Crashes, No Sound, or Screen Glitches?
Random freezes, missing sound and display glitches usually trace back to one bad driver. Find and replace yours safely.Free scan · under a minuteWindows Errors? Fix Them Before They Spread
Repair common Windows errors and clear accumulated junk for a smoother, more stable PC - no reinstall needed.Free scan · no reinstallIs the president responsible for the federal budget deficit?
A president has substantial influence through budget proposals, negotiations, signing or vetoing legislation, administration of federal programs, and some executive actions. However, Congress controls taxation, borrowing authority, appropriations, and most changes to mandatory spending. Recessions, wars, pandemics, interest rates, automatic stabilizers, and previously enacted laws also affect the deficit.
Why is a president’s first fiscal year misleading?
The federal fiscal year runs from October 1 through September 30, while presidents take office in January. The first fiscal year ending during a presidency began under the prior administration and may reflect the prior president’s budget request, existing appropriations, continuing resolutions, and previously enacted mandatory programs. CRS discusses this issue in its transition-year budget analysis.
What is the difference between the deficit and the national debt?
The deficit is the amount by which outlays exceed receipts in one fiscal year. Debt is the accumulated stock of federal borrowing resulting from past deficits and other adjustments. A smaller deficit still increases debt if it remains positive; only a surplus reduces borrowing from the annual budget result, and other debt adjustments can also matter.
Why do Treasury, CBO, OMB, and FRED show slightly different deficit figures?
Differences can result from rounding, revisions, agency reconciliations, timing adjustments, accounting conventions, and publication dates. The federal budget generally uses a modified cash basis, while Treasury’s financial statements use accrual accounting for some measures. A comparison should use one consistent historical series and identify its data vintage.
Do these 3 things before closing this tab:
1Clear out junk files and repair common Windows errors2Scan for outdated or missing drivers - takes under a minute3Repair Windows errors before they cause bigger problemsIs the FY2026 deficit an actual result yet?
No. As of August 10, 2026, FY2026 was still in progress and ends on September 30, 2026. CBO reported approximately $1.4 trillion through the first nine months and projected a full-year deficit of roughly $1.9 trillion. Those are year-to-date and projected figures, not the final annual deficit.
Should presidents be compared by total dollars or deficit as a percentage of GDP?
Use both, because they answer different questions. Nominal dollars describe the amount borrowed at the time, while deficit-to-GDP measures the shortfall relative to the size of the economy. For very long historical comparisons, constant-dollar data can also help. Neither measure alone establishes presidential responsibility.
The Bottom Line
The most accurate answer is not a one-name ranking. FY2020 had the largest nominal annual deficit in the modern OMB/FRED series, while FY1943 had the largest deficit relative to GDP. FY2025 was the latest completed year as of August 10, 2026, with an approximately $1.775 trillion deficit. To compare presidents fairly, use fiscal-year data, mark transition years, distinguish deficits from debt, separate actual results from proposals and projections, and use policy scoring rather than annual outcomes alone to discuss responsibility.
Quick Recap
Product prices and availability are accurate as of the date/time indicated and are subject to change. Any price and availability information displayed on Amazon at the time of purchase will apply.




