The Tool Desk
Outbyte PC Repair FREEClear out junk files and repair common Windows errorsFree Scan →Outbyte Driver Updater FREEFix the driver behind crashes, sound loss and screen glitchesFind Drivers →A 2024 iSeeCars analysis, as reported by Futurism and Road & Track, estimated 5.6 fatal crashes per billion miles for Tesla vehicles in its model-year 2018–2022 comparison. The reported average for all cars was 2.8 per billion miles. These are estimates for a defined group of vehicles and crashes—not a current rate for every Tesla, a measure of all collisions, or an explanation of why the rates differed.
What the study reported
The comparison was attributed to iSeeCars and based on Fatality Analysis Reporting System (FARS) data. Futurism reported the following estimates for the study’s model-year 2018–2022 comparison:
| Measure or brand | Reported rate | Source and qualification |
|---|---|---|
| Tesla | 5.6 fatal crashes per billion miles | iSeeCars analysis, reported by Futurism in 2024; covers the study’s model-year 2018–2022 population. |
| All cars | 2.8 fatal crashes per billion miles | iSeeCars analysis, reported by Futurism in 2024; the comparison average. |
| Kia | 5.5 fatal crashes per billion vehicle miles | iSeeCars analysis, reported by Road & Track in 2024; covers the same model-year comparison. |
| Buick | 4.8 fatal crashes per billion vehicle miles | iSeeCars analysis, reported by Road & Track in 2024; covers the same model-year comparison. |
The reports describe Tesla as having the highest brand rate in the comparison, narrowly ahead of Kia. The figure is a mileage-normalized rate: it is not a raw count of crashes, and it does not mean that a particular Tesla driver has a 5.6-in-a-billion personal chance of dying.
What counted as a fatal crash
Futurism says iSeeCars selected crashes involving model-year 2018–2022 vehicles with at least one occupant death. That scope is narrower than FARS as a whole. NHTSA describes FARS as a census of qualifying fatal motor-vehicle traffic crashes in the 50 states, Washington, D.C., and Puerto Rico. To qualify, a crash must occur on a trafficway customarily open to the public and result in an occupant or nonoccupant death within 30 days. See NHTSA’s FARS description.
#1 Best Overall

- Made of zinc alloy with ABS plastic parts
- 5.9 inch x 2.2 inch x 1.8 inch(size)
- The two sides of doors could be opened,front and back covercould be opened too
- You can pull back the car,then it can move forwards with Lights and Sound
- Very suitable as children 4 years and up toys for birthday,Christmas gift, new year. Also it can be a gift for your boyfriend
So the reported iSeeCars outcome should not be read as a tally of every fatal road-user outcome recorded in FARS: the coverage of the underlying federal database is broader than the occupant-fatality subset described in the news coverage.
What the result does—and does not—show
It compares rates, not every collision
A rate per billion miles adjusts the fatal-crash figure for vehicle miles traveled, rather than simply comparing how many crashes involved each brand. The reported result concerns fatal crashes in the specified model-year group; it does not describe nonfatal crashes, all vehicle years, or an individual driver’s likelihood of being killed.
Rank #2
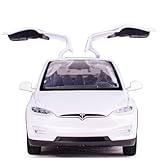
- Made of zinc alloy with ABS plastic parts
- 5.9 inch x 2.2 inch x 1.8 inch(size)
- The two sides of doors could be opened,front and back covercould be opened too
- You can pull back the car,then it can move forwards with Lights and Sound
- Very suitable as children 4 years and up toys for birthday,Christmas gift, new year. Also it can be a gift for your boyfriend
It does not establish a cause
A brand-level association cannot by itself identify whether driver behavior, speed, road conditions, vehicle mix, or vehicle design accounts for a difference. The comparison does not prove that Tesla vehicles caused the rate or that a driver-assistance feature produced it.
Futurism attributed to iSeeCars executive analyst Karl Brauer the view that driver behavior can counteract safety improvements, including through distraction and higher speeds. The article also quoted him saying that many vehicles in the comparison had favorable crash-test results and that he did not view vehicle design as the explanation. Those are Brauer’s interpretations, not causal findings established by the rate comparison.
What’s actually slowing this PC down?
Pick the symptom - the matching free tool is one click away.
Rank #3

- Made of zinc alloy with ABS plastic parts
- 5.9 inch x 2.2 inch x 1.8 inch(size)
- The two sides of doors could be opened,front and back covercould be opened too
- You can pull back the car,then it can move forwards with Lights and Sound
- Very suitable as children 4 years and up toys for birthday,Christmas gift, new year. Also it can be a gift for your boyfriend
How much confidence to put in the ranking
The reported figures are secondary accounts of an iSeeCars analysis using FARS data; NHTSA is the source of the crash database, not the author of the brand ranking. The original iSeeCars calculation tables and mileage estimates are not available in the cited reports, so the figures cannot be independently reproduced from those accounts. Treat the ranking as a reported result for this particular comparison, rather than an official NHTSA determination or a definitive measure of present-day vehicle safety.
Quick Recap
Rank #4
![Matchbox Tesla Model Y, 70 Years 89/100 [White]](https://m.media-amazon.com/images/I/51XQmx0TiDL._SL160_.jpg)
- Toy Vehicle Form: Car
- Theme: Car
Product prices and availability are accurate as of the date/time indicated and are subject to change. Any price and availability information displayed on Amazon at the time of purchase will apply.




