September’s reported losses were sharper than the headline figures suggest: the World Gold Council says gold fell 8.5% month over month, while precious-metals dealer USAGOLD reported silver down 15.77%. Those figures come from different sources, and the available reports do not establish a matched comparison using the same benchmark and interval. Higher US Treasury yields and a stronger dollar were major pressures on gold; changing futures positions also mattered. Inflation concerns may feed into rate and yield expectations, but they do not by themselves explain the metals’ decline.
What happened to gold and silver?
The World Gold Council (WGC) reports that gold ended September 2026 at US$4,176 per ounce, down 8.5% from the prior month. USAGOLD, a precious-metals dealer, reported silver down 15.77% for September. The two percentages should not be treated as a precise apples-to-apples comparison: the reports do not establish a common price benchmark and calculation basis for both returns.
The often-cited pairing of a 14% silver drop and a 7% gold drop is therefore not verified by these September figures. Another period can produce different percentages: the London Bullion Market Association (LBMA) reported Q2 2026 losses of 14.70% for gold and 21.47% for silver. Those are quarter-specific figures, not September returns.
| Report and period | Gold | Silver | How to read it |
|---|---|---|---|
| WGC, September 2026 | Down 8.5%; ended at US$4,176 per ounce | Not stated by the WGC in the cited September summary | WGC gold-market commentary; month-over-month gold return. |
| USAGOLD, September 2026 | Not stated as a matched comparison in the cited report | Down 15.77% | Dealer-reported monthly figure, not a verified benchmark-matched return against the WGC gold figure. |
| LBMA, Q2 2026 | Down 14.70% | Down 21.47% | Same-period quarterly performance figures; not September data. |
Returns depend on the instrument and window being measured: spot indications, a benchmark price, or futures can differ, as can an intraday move and a full-month return. When comparing figures, check the price basis, currency, unit, and exact start and end dates.
Recommended Free Tools
#1 Best Overall

- ✔️1 oz 2026 American Silver Eagle Coin
- ✔️Obverse: Adolph A. Weinman’s design of Lady Liberty wrapped in the American flag and elegantly striding over a ridge while the sun rises.
- ✔️Reverse: One eagle flying into land while carrying an oak branch in its talons.
Why did gold fall in September?
The WGC’s September commentary points to higher bond yields, a stronger US dollar, and reduced futures positioning as important contributors to gold’s decline. Its Gold Return Attribution Model groups monthly drivers into economic expansion, risk and uncertainty, opportunity cost, and momentum; it does not establish one factor as the sole cause. The WGC’s September 2026 review reports that the US 10-year Treasury yield rose 53 basis points to 5.3%, while the DXY dollar index gained 2% during the month.
Higher yields raise the opportunity cost
Gold does not pay interest. When Treasury yields rise, investors can earn more from some interest-bearing assets, making non-yielding gold less attractive at the margin. That mechanism can weigh on gold prices; it does not mean every rise in yields produces an identical move.
Rank #2
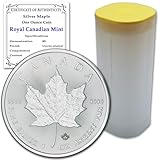
- Purity: .9999 Fine Silver
- Diameter: 38 mm; Thickness: 3.29 mm
- Metal Content: 1 Troy Ounce per Coin; Total: 10 Troy Ounces
- Stock Photo; Image is indicative of quality; Maple Tubes Available with coins while supplies last
- DISCLAIMER: Please note that we pull random year coins from the same tube, so all coins received per purchase will be from the same year— mixed bags are highly unlikely, ensuring a consistent and uniform collection for your enjoyment!
A stronger dollar can pressure dollar-priced metals
Gold and silver are commonly quoted in US dollars. A stronger dollar can make them more expensive for buyers using other currencies, potentially reducing demand or adding pressure to dollar prices. The WGC identifies the dollar’s September gain as one of the major contributors to gold’s fall.
Futures positioning moved lower, but investment flows were mixed
WGC data show COMEX managed-money positions fell by US$12 billion, or 84 tonnes, in September; spreading positions fell by US$22 billion, or 156 tonnes. At the same time, global gold ETFs recorded US$10 billion, or 67 tonnes, in inflows. These contrasting figures show that investors did not all move in the same direction: futures positioning declined while ETF holdings rose.
Rank #3

- Purity: .999 Fine Silver
- Diameter: 40.6 mm; Thickness: 3.2 mm
- Stock Photo; Image is indicative of quality
- Metal Content: 1 Troy Ounce per Coin; Total: 10 Troy Ounces
- You will receive ten coins per purchase; DISCLAIMER: Please note that we pull random year coins from the same tube, so all coins you receive will be from the same year— mixed bags are highly unlikely, ensuring a consistent and uniform collection for your enjoyment!
How inflation fears and interest rates fit in
Inflation concerns can influence expectations about future interest rates and bond yields. If investors expect rates to remain higher, or rise, the potential return on bonds and cash can reduce the appeal of metals that do not pay interest. That is a plausible market channel—not proof that inflation fears alone caused the September decline, nor evidence that rates were unchanged throughout the relevant market period.
The LBMA’s Q2 2026 report describes how geopolitical conflict raised energy and inflation concerns and could increase expectations that rates would stay high or rise. Its discussion offers context for how inflation and rate expectations may affect precious metals, but its price figures cover Q2, not September. Read the LBMA’s Q2 2026 market report.
Rank #4

- Purity: .999 Fine Silver
- Diameter: 40.6 mm; Thickness: 3.2 mm
- Stock Photo; Image is indicative of quality
- Metal Content: 1 Troy Ounce per Coin; Total: 20 Troy Ounces
- You will receive twenty coins per purchase in an official United States Mint Tube; DISCLAIMER: Please note that we pull random year coins from the same tube, so all coins received per purchase will be from the same year— mixed bags are highly unlikely, ensuring a consistent and uniform collection for your enjoyment!
Fiscal and inflation uncertainty can also affect term premiums and demand for safe-haven assets, so the relationship is not simply “inflation up, gold down.” The WGC discusses those uncertainties alongside September’s yield, dollar, and positioning pressures; none should be mistaken for a proven, exclusive cause.
Independent reader supportYour contribution helps us test, update, and keep practical guides available for everyone.Why silver’s decline may look larger
The available September reports do not provide a matched volatility calculation for gold and silver, so they cannot quantify how much more volatile silver was over that month on a comparable basis. The LBMA’s Q2 figures do give a direct same-period comparison: silver fell 21.47%, versus gold’s 14.70%. That shows silver lost more in that quarter; it does not establish the cause of the September difference.
The Tool Desk
Outbyte Driver Updater FREEScan for outdated or missing drivers - takes under a minuteDriver Scan →Outbyte PC Repair FREERepair Windows errors before they cause bigger problemsFix Now →Best Value
- Purity: .999 Fine Silver
- Diameter: 40.6 mm; Thickness: 3.2 mm
- Metal Content: 1 Troy Ounce per Coin; Total: 10 Troy Ounces
- Stock Photo; Image is indicative of quality
- You will receive ten coins per purchase; DISCLAIMER: Please note that we pull random year coins from the same tube, so all coins received per purchase will be from the same year— mixed bags are highly unlikely, ensuring a consistent and uniform collection for your enjoyment!
Longer-term supply and demand are separate from short-term price attribution. The Silver Institute and Metals Focus report a 2025 silver supply deficit of 40.3 million ounces despite a 7% increase in supply and a 2% contraction in total demand. That annual market balance is useful background, but it does not explain a particular month’s price move. See the World Silver Survey 2026.
What the October 7 prices do—and do not—tell you
In its October 7, 2026 report, USAGOLD gave same-day spot indications of US$4,121.26 per ounce for gold and US$60.68 per ounce for silver, each down about 1.0% on the day at the dealer’s observation time. These are dated dealer indications, not permanent prices or a substitute for a specified benchmark close. See USAGOLD’s October 7 market report.
A single daily observation cannot confirm a monthly return or indicate what prices will do next. For personal-finance decisions, keep market context separate from a buy-or-sell conclusion: the cited reports describe past price movements and drivers, not a forecast or a recommendation.
How to check a precious-metals price comparison
- Match the dates: confirm that both assets cover the same start and end dates and return period.
- Match the basis: distinguish spot prices, benchmark prices, futures, and dealer quotes.
- Check units and currency: confirm the figures use the same currency and comparable units, such as dollars per troy ounce.
- Keep attribution separate from explanation: note which report identifies yields, the dollar, positioning, or investor flows, and avoid presenting a plausible mechanism as a proven single cause.
The WGC’s 2026 mid-year outlook discusses broader gold-market sensitivity to investor sentiment, yields, and rate expectations, but it does not turn a September return into a forecast.
Quick Recap
Product prices and availability are accurate as of the date/time indicated and are subject to change. Any price and availability information displayed on Amazon at the time of purchase will apply.




