Brent could approach $90–$100 per barrel if the Strait of Hormuz disruption persists; a sustained move above $120 would likely require a much larger, prolonged physical supply loss. If shipping normalizes, the latest EIA forecast points instead to an average of $74 in the third quarter of 2026 and $65 in 2027. The August rebound is a geopolitical recovery after a sharp selloff, not an uninterrupted oil rally.
Brent crude reached $82.49 a barrel on Thursday, August 6, 2026, after rising 3.8%, according to the Associated Press. During the U.S.-Iran conflict, Brent reached as high as $113 per barrel, the AP reported. Brent had fallen roughly $32 from its April peak and averaged about $85 in June, according to the U.S. Energy Information Administration (EIA).
The latest rebound is primarily a geopolitical move. Prices are responding to uncertainty over whether the Strait of Hormuz will reopen, rather than to a clean, persistent imbalance between global oil demand and supply.
For households, the practical question is not whether oil can briefly spike. It can. The more useful question is whether the disruption lasts long enough to keep gasoline, heating and transportation costs elevated.
#1 Best Overall

- Package includes: This set includes 12 trading chart pattern posters and 100 adhesive dots, providing you with all you need for easy setup. Designed for stock traders, investors, and financial enthusiasts, these candlestick patterns posters serve as a comprehensive trading patterns cheat sheet, making them a must-have for any trading workspace or educational setting.
- Exquisite design: With a sleek black background and professional layout, our candlestick patterns poster presents essential stock chart patterns in a clear format. Whether you're a beginner or experienced trader, this stock trading poster offers a quick reference while enhancing your office, trading desk, or classroom.
- Premium quality: Printed on thick, durable card stock, these stock candlestick patterns charts ensure sharp text and graphics for easy studying. The laminated surface adds water resistance and easy cleaning, keeping your candle chart posters in pristine condition.
- Suitable size: Each stock market trading poster measures 11 x 15.7 inches, making them large enough for clear readability yet compact enough to fit neatly on a wall, door, or bulletin board. Whether placed in a trading office, stock market classroom, or investment meeting room, these trading candlestick patterns posters provide a practical and visually appealing learning tool.
- Wide applications: Ideal for trading professionals, stock market beginners, financial educators, and crypto investors, this stock candlestick patterns chart is a versatile tool for offices, study rooms, home trading setups, and conference spaces. Whether used as a trading patterns cheat sheet or educational wall decor, these trading candlestick patterns are a valuable resource for anyone looking to master trading chart patterns with confidence.
How high could oil go?
The likely range depends chiefly on whether Hormuz shipping recovers. These are scenarios, not guaranteed price targets:
| Scenario | Possible Brent outcome | What would drive it |
|---|---|---|
| Reopening and normalization | Mid-$70s in the near term; potentially mid-$60s in 2027 | Hormuz reopens, Gulf exports recover and inventories rebuild |
| Continued disruption | $90–$100; a retest of the reported $113 conflict high is possible | Shipping restrictions, attacks or prolonged tanker avoidance |
| Severe physical supply shock | Above $120 is possible | Large, sustained losses of physical oil, rapidly falling inventories and limited replacement capacity |
The most defensible near-term ceiling without a new major supply loss is approximately $90 to $100 per barrel. A move above $120 would require more than alarming headlines. It would likely require a prolonged loss of supply, insurers and shipowners refusing to use the route, falling inventories and limited replacement capacity.
Hormuz is the market’s main switch
Before the conflict, roughly one-fifth of the world’s traded oil and natural gas moved through the Strait of Hormuz, according to the Associated Press. That does not mean one-fifth of all oil production passes through the waterway; the figure refers to traded flows using the route.
That distinction matters because a disruption can affect prices even before global production falls by the same amount. If tankers cannot safely collect or deliver cargoes, refiners and governments may compete for available barrels, while traders build a risk premium into futures prices.
The Tool Desk
Outbyte Driver Updater FREEScan for outdated or missing drivers - takes under a minuteDriver Scan →Outbyte PC Repair FREEClear out junk files and repair common Windows errorsFree Scan →Iran and Oman were reported on August 5 to be in the final stage of drafting an agreement intended to reopen the strait, according to the Associated Press. The agreement remained conditional. An announcement would not automatically restore normal trade: tankers still need to sail, crews need to accept the risk and insurers need to provide coverage.
This creates a binary market risk:
- A credible, operational reopening could remove much of the geopolitical premium and push prices lower quickly.
- A failed agreement or renewed shipping attacks could restore the premium and send Brent back toward its conflict high.
What the official forecasts say
The latest available EIA forecast, released July 7, projected Brent at an average of $74 per barrel in the third quarter of 2026 and $65 in 2027. The EIA expects recovering production, restored trade flows and less severe inventory draws to pull prices down. Its next Short-Term Energy Outlook was scheduled for August 11, so the July report is the latest official baseline before that release.
Rank #2
- Canvas wall art size: 3 Panels wall art size is 14x28 inchx3 (35x70cmx3), Dimension: 28''W x 41''H (70x105cm). Every canvas can be personalized, If you like to show your photos or pictures on the canvas, please contact us directly.
- Wall decor: A perfect wall decorations for living room, bedroom, kitchen, office, Hotel, dining room, office, bathroom. And the Canvas wall art can as a gift for friends, family and lovers on Christmas, thanksgiving day, mother's day, father's day, children's day, Easter, All Saints' Day, Halloween.
- Home decor ready to hang: 5 pieces wall painting was stretched by dry timber frame, and the paintings are light weight. Each panel also has hook mounted and traceless nails, can help you hung easily on the wall.
- Excellent quality: The canvas of wall art has no smell of oil painting, and has the highest durability. you can easy to clean with wet rags. Adopt advanced and excellent canvas printing technology can ensure that the image is clear and realistic.
- Customer service: All artworks were strict quality control before leaving the factory. If you received any questions about the items, please contact us immediately. The colors may be slightly different from the screen display of different brands.
The EIA’s forecast is less bearish about the immediate supply shock than its previous estimate. It expects global inventories to fall by 2.2 million barrels per day in the third quarter, compared with more than 7 million barrels per day in its June forecast. It then expects the market to move back into oversupply in 2027 as production rises.
The International Energy Agency (IEA) also described a market that could become oversupplied if Gulf transit volumes improve. In its July report, North Sea Dated crude was trading around $77 when the report was written. The IEA projected 2026 oil demand to decline by approximately 1 million barrels per day, followed by growth of about 2 million barrels per day in 2027. It said global supply could expand by 7.5 million barrels per day in 2027 if transit volumes recover.
Those forecasts are not promises. They depend heavily on the strait reopening and on the physical oil system functioning normally again.
Supply is recovering, but the recovery is incomplete
The IEA reported that global oil supply rebounded by 4.1 million barrels per day to 98.8 million barrels per day in June 2026 as some Gulf flows resumed. Even after that increase, output remained approximately 9.4 million barrels per day below pre-war levels.
Gulf oil exports, including shipments using routes that bypass Hormuz, increased by 6.5 million barrels per day in June to 16.1 million barrels per day. That was still below the pre-war average of 24 million barrels per day.
Inventory data also require careful reading. The IEA reported that observed global inventories rose by 21 million barrels in June, the first monthly increase in four months. Yet OECD inventories fell by 62 million barrels, including an estimated 44 million barrels from government stock releases. Headline inventory growth therefore does not necessarily mean commercial markets are comfortably supplied.
What’s actually slowing this PC down?
Pick the symptom - the matching free tool is one click away.
Rank #3

- High-Quality Canvas Prints: Available in various sizes from 8x12in to 24x36in, this unframed or framed poster is printed on high-quality canvas, ensuring vibrant colors and long-lasting durability.
- Comprehensive Stock Analysis: This trading chart patterns poster is a must-have tool for investors and traders, featuring detailed stock market patterns and bullish analysis to enhance your trading strategies.
- Versatile Decor Options: Perfect for any space, whether it's your office, living room, bedroom, or even the kitchen. The aesthetic design makes it an excellent addition to your farmhouse or modern decor.
- Educational and Practical: Designed as a cheat sheet, this poster includes essential chart patterns and trading places, making it a valuable reference guide for both beginners and experienced traders.
- 【After Sale Service 】Once your poster Sets for Room Aesthetic artwork arrives,If you have any other questions, please you can contact us through Amazon anytime and anywhere ,we will answer you in the shortest time.Your satisfaction is our only pursuit.
Refinery operations remain another constraint. Global refinery runs were down about 6 million barrels per day year over year in June, according to the IEA. Middle Eastern export refineries had not fully restarted, while Russian refinery throughput was also curtailed.
OPEC+ is adding barrels, but not enough to solve a blocked route
Seven OPEC+ countries—Saudi Arabia, Russia, Iraq, Kuwait, Kazakhstan, Algeria and Oman—approved a combined 188,000-barrel-per-day production increase for August 2026, according to OPEC. The decision continues the gradual unwinding of additional voluntary cuts announced in 2023.
That figure should not be treated as 188,000 barrels per day immediately appearing in global consumer markets. It is a production adjustment or target. Actual supply depends on production capacity, compliance, infrastructure and shipping access.
The increase is also small compared with a supply shock measured in millions of barrels per day. It is unlikely to offset a prolonged Hormuz disruption. If shipping normalizes, however, the added production becomes more bearish because it would arrive at the same time as recovering Gulf flows.
Free tools Windows power users keep installed
One-click scans. No signup required.
Why the rally may reverse quickly
Oil futures can move sharply when the market is pricing uncertainty rather than a permanent loss of supply. A confirmed and operational reopening could have several effects at once:
- Previously restricted cargoes could move more freely.
- Refiners and governments would have less reason to stockpile precautionary barrels.
- Insurance and shipping costs could ease.
- The geopolitical premium in front-month futures could unwind.
- Returning production could rebuild inventories and push the market toward surplus.
That is why a price near $82 does not necessarily point toward $100. The same event that caused the rally—a perceived threat to supply—could also cause a fast decline if the threat is removed.
Rank #4
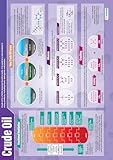
- EDUCATIONAL CHART DESIGNED BY TEACHERS: Our Crude Oil poster helps students to learn, engage and remember more information than ever before. Covering the basics of how crude oil is formed and distilled, this unique school poster can play a vital role in improving both students' understanding and classroom décor.
- SUPPLEMENT KNOWLEDGE: Our educational school posters are colorful, beautifully illustrated and contain a huge amount of valuable information. This Science poster is specifically designed to help students gain a greater understanding of how crude oil is formed and distilled. The wall chart is a great resource for Schools, Classrooms, Science Teachers, Students, Tutors, Home School Parents and Home School Kids.
- MAKE LEARNING FUN: Engaging, clear and colorful designs and images create a fun learning environment in which students can excel. Our amazing wall posters can help to increase students’ interest towards Science, while recapping any key information they've been taught.
- LARGE SIZE – IDEAL FOR READING FROM A DISTANCE: Our school wall charts are a generous size, measuring 33” x 23.5”. This ensures all posters are easily readable from a distance. Our educational posters are a fantastic way of brightening and decorating any classroom and can easily complement every type of learning environment.
What higher oil means for personal finances
Consumers do not pay the Brent price directly, but crude prices influence several household expenses. Gasoline and diesel usually respond first, followed by transportation costs, airfares, delivery charges and some manufactured goods. Heating oil and other petroleum products can also become more expensive, depending on location and season.
The effect is not one-for-one. Retail fuel prices also reflect refining margins, taxes, distribution costs, currency movements and local competition. A temporary oil spike may therefore have a smaller household effect than a sustained period of elevated prices.
Practical steps are more useful than trying to call the exact oil top:
- Do not make a large investment decision based on one oil headline. A $100 bank forecast may be an annual average or a scenario, not a prediction that oil trades at $100 every day.
- Review fuel-sensitive spending. Combine errands, compare fuel prices and check whether a commute or delivery habit can be changed temporarily.
- Protect the emergency fund. If fuel or heating costs rise, cash reserves can prevent a short-term price shock from becoming credit-card debt.
- Use a realistic budget range. Test your monthly budget with fuel costs 10% or 20% above normal rather than assuming today’s price will persist.
- Be cautious with energy stocks and funds. Producers may benefit from higher crude prices, but companies also face political risk, operating costs, debt, refining exposure and sharp commodity-price reversals.
What would disprove the bearish price forecast?
The EIA and IEA outlooks depend on several conditions. The bearish case becomes weaker if any of these fail:
- The reopening is only political, not operational. An agreement must be implemented, with unresolved questions involving control of the strait and U.S. restrictions addressed.
- Tankers continue avoiding the route. A waterway can be technically open while insurance, crews or shipowners keep traffic well below normal.
- Refineries do not recover. Crude supply alone does not restore fuel markets if export refineries remain damaged or offline.
- Demand does not weaken. The IEA expects demand to contract by about 1 million barrels per day in 2026, partly reflecting the economic effect of the crisis. Stronger-than-expected demand would make the market tighter.
How to read the next oil-market headlines
Focus on physical evidence, not just the quoted futures price. The most useful indicators are:
- Whether commercial tanker traffic through Hormuz actually increases
- Insurance rates and shipping delays
- Gulf export volumes, not only production targets
- OECD commercial inventories after government stock releases are separated out
- Refinery utilization and product inventories
- The structure of futures prices: persistent backwardation can indicate near-term tightness, while contango can signal improving supply
A single daily move cannot answer whether the rally is durable. Several weeks of restored shipments and rebuilding commercial inventories would matter far more than one diplomatic announcement.
Do these 3 things before closing this tab:
1Repair Windows errors before they cause bigger problems2Fix the driver behind crashes, sound loss and screen glitches3Clear out junk files and repair common Windows errorsBest Value

- High-Quality Canvas Wall Art: Available in various sizes from 8x12 inches to 24x36 inches, this canvas wall art is printed on high-quality materials, ensuring durability and a vibrant, long-lasting image. Suitable for unframed, framed, or wframed options.
- Comprehensive Technical Analysis Guide: This trading chart patterns poster serves as an essential technical analysis guide, featuring a wide range of candlestick patterns and chart patterns, making it a valuable tool for stock traders and investors.
- Stock Market Decor: Perfect for adding a professional and educational touch to your home or office, this stock market decor is ideal for traders, analysts, and enthusiasts. It enhances the aesthetic of any space, from living rooms to offices.
- Candlestick Patterns Cheat Sheet: The poster includes a detailed cheat sheet of candlestick patterns, providing a quick reference for identifying and interpreting key patterns in the stock market. Ideal for both beginners and experienced traders.
- 【After Sale Service 】Once your poster Sets for Room Aesthetic artwork arrives,If you have any other questions, please you can contact us through Amazon anytime and anywhere ,we will answer you in the shortest time.Your satisfaction is our only pursuit.
FAQ
Could Brent reach $100 per barrel?
Yes. A prolonged Hormuz disruption, renewed attacks or continued tanker avoidance could push Brent toward or above $100. Barclays maintained a $100 average Brent forecast for 2026 in a May 22 note, with risks skewed higher while the strait remained closed. That is a forecast average or scenario, not a guarantee of a constant $100 price.
Could oil rise above $120?
It is possible, but a sustained move above $120 would likely require a large and continuing physical supply loss, rapidly falling inventories and limited replacement capacity. Political tension by itself may not be enough.
What is the most likely oil-price scenario?
If the Strait of Hormuz reopens and Gulf exports normalize, the rally could fade. The EIA’s latest available forecast called for average Brent of $74 in the third quarter of 2026 and $65 in 2027.
Will higher crude prices automatically make gasoline more expensive?
Not automatically or immediately. Gasoline also depends on refinery margins, taxes, distribution costs, local competition and currency movements. A sustained crude-price increase is more likely to affect household fuel budgets than a brief futures-market spike.
Quick wins for a faster PC:
Fix the driver behind crashes, sound loss and screen glitchesFind Drivers →Clear out junk files and repair common Windows errorsFree Scan →Does the OPEC+ increase add 188,000 barrels per day to supply right away?
No. The 188,000-barrel-per-day figure is an approved production adjustment. Actual additional exports depend on capacity, compliance, infrastructure and whether ships can safely reach buyers.
The Bottom Line
Bottom line: Brent’s move back above $82 is a geopolitical rebound after a sharp selloff, not proof of an uninterrupted rally. If Hormuz reopens and shipping normalizes, official forecasts point toward the mid-$70s in late 2026 and roughly $65 in 2027. If the disruption persists, $90–$100 is credible and the reported $113 conflict high could be retested. Prices above $120 would require a much more serious, sustained physical supply shock.
For personal finances, plan for volatility rather than betting your budget on one price target. Keep cash reserves, stress-test fuel and transport spending, and treat energy investments as high-risk positions whose gains can disappear when the geopolitical premium unwinds.
Quick Recap
Product prices and availability are accurate as of the date/time indicated and are subject to change. Any price and availability information displayed on Amazon at the time of purchase will apply.
Recommended Free Tools




