They could have cushioned losses over the year to 30 September 2026, but that is a historical example, not a forecast or a recommended allocation. Mint, citing FundsIndia’s October 2026 Wealth Conversations report, says the Nifty 50 TRI fell 7.1% over that period, while gold in rupees, US equities and debt posted positive returns. The figures illustrate how different exposures can change a portfolio’s result; they do not show that those assets will offset Indian equities in the next downturn.
What did the reported returns show?
The following returns are CAGRs attributed by Mint to FundsIndia’s October 2026 Wealth Conversations report, as of 30 September 2026. The figures are reported, not independently recalculated here. The table uses the report’s labels; Mint’s page does not further define the debt or real-estate measures.
As an Amazon Associate I earn from qualifying purchases.
| Asset or index | 1 year | 3 years | 5 years | 10 years | 15 years | 20 years |
|---|---|---|---|---|---|---|
| India equity (Nifty 50 TRI) | -7.1% | 6.1% | 6.4% | 11.5% | 12% | 11% |
| Debt | 5% | 6.7% | 6% | 6.7% | 7.5% | 7.5% |
| Real estate | 8.5% | 7% | 6.9% | 5.5% | 6.1% | 7.5% |
| Gold (INR) | 18% | 37.2% | 25.4% | 16.4% | 11.4% | 14.3% |
| US equity (S&P 500 total return in INR) | 25% | 29% | 19.8% | 19.6% | 21% | 15.4% |
The one-year comparison is striking: the Nifty 50 TRI was down 7.1%, against reported gains of 25% for the S&P 500 total return in rupees, 18% for gold in rupees and 5% for debt. Those are outcomes for a particular window. The table does not establish that these assets will move in opposite directions in every market shock, nor does it establish an ideal mix for an individual investor.
The Tool Desk
Outbyte PC Repair FREEClear out junk files and repair common Windows errorsFree Scan →Outbyte Driver Updater FREEFix the driver behind crashes, sound loss and screen glitchesFind Drivers →What would an equally split portfolio have done in that year?
Mint’s illustration applies those reported one-year returns to ₹20,000 in each of five categories: Indian equities, US equities, gold, real estate and debt. It estimates a total value of ₹1,09,880 from the original ₹1 lakh, compared with about ₹92,900 for an assumed Nifty 50 index-fund investment.
#1 Best Overall

- Purity: .9167 Fine Gold
- Metal Content: 1 Troy Ounce
- Diameter: 32.8 mm; Thickness: 2.84 mm
- Stock Photo; image is indicative of quality
- You will receive one coin per purchase graded Gem Uncirculated by PCGS. The year will vary and we are unable to accommodate specific year requests
| ₹20,000 allocation | Estimated value after applying the reported one-year return |
|---|---|
| Indian equities | ₹18,580 |
| US equities | ₹25,000 |
| Gold | ₹23,600 |
| Real estate | ₹21,700 |
| Debt | ₹21,000 |
| Total for the five equal allocations | ₹1,09,880 |
| Assumed Nifty 50 index-fund example | About ₹92,900 |
This is arithmetic using Mint’s reported returns, not an independently verified backtest. Mint says the Nifty index-fund comparison ignores tracking error. The example does not account for investor-specific taxes, fees, access restrictions, rebalancing or the way a particular product tracks its exposure. It should not be read as evidence that an equal split is suitable or that the same result will recur.
Why does a Nifty 50 investor still have concentration in one market?
The Nifty 50 is diversified within Indian listed equities: the National Stock Exchange says it comprises 50 stocks across 13 sectors and is used as a benchmark and by index funds. As of 30 March 2026, it represented about 53.73% of the free-float market capitalization of stocks listed on the NSE. That breadth does not make it global or cross-asset diversification; a Nifty 50 holding remains exposed to Indian equity-market risk.
Rank #2

- ✔️Each coin contains 1/10 oz of gold.
- ✔️Obverse: Lady Liberty holding a torch with an olive branch.
- ✔️Reverse: The Type 1 reverse, used from 1986-2021, shows a male bald eagle in flight carrying an olive branch to his nest, where a female awaits with her young. The Type 2 reverse, introduced in 2021, shows a bold close-up portrait of an eagle.
- ✔️Each Gold Eagle is a sovereign monetized bullion coin fully guaranteed by the U.S. Mint.
What can each exposure add—and what can still go wrong?
US equities
US equity exposure adds a different country’s stock market to an India-focused portfolio. In the cited comparison, the S&P 500 total return is expressed in rupees, so the reported figure reflects that currency denomination. It remains equity exposure and can lose value; the one-year result does not establish how it will perform alongside Indian stocks in a future decline.
Recommended Free Tools
Gold
SEBI describes precious metals such as gold as assets some investors use as a store of value or a hedge against economic uncertainty and inflation. Gold prices are also affected by economic and geopolitical conditions and by supply and demand. It may diversify a portfolio, but it is not a guaranteed hedge or a guaranteed source of positive returns.
Rank #3
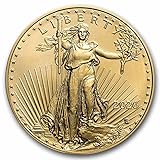
- ✔️Each coin contains 1/10 oz of gold.
- ✔️Obverse: Lady Liberty holding a torch with an olive branch.
- ✔️Reverse: Portrait with an American bald eagle, a design by Jennie Norris in 2021.
- ✔️Each Gold Eagle is a sovereign monetized bullion coin fully guaranteed by the U.S. Mint.
Debt
Debt exposure may behave differently from equities, but debt mutual funds are not risk-free or assured-return products. AMFI identifies interest-rate, issuer credit, spread, market and liquidity risks. In general, when interest rates rise, prices of existing fixed-income securities fall. Corporate debt has more credit risk than government securities, and a widening spread can reduce debt-security values.
Hybrid, multi-asset and exchange-traded structures
AMFI describes hybrid funds as combining equity and debt, with risk partly dependent on the equity share. Multi-asset funds may span equity, fixed income, index strategies, derivatives and commodities such as gold. ETFs can track an index, commodity, bond or basket and trade on exchanges. These labels describe structures, not a guarantee of diversification or an endorsement. Review a scheme’s documents, holdings, costs, liquidity and risks rather than relying on its name.
Rank #4
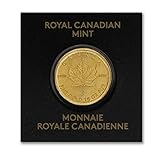
- Purity: .9999 Fine Gold (24-Karat)
- Diameter: 8 mm (0.314961 inches)
- Metal Content: 0.0322 Troy Ounces
- Stock Photo; Image is indicative of quality
- You will receive one coin per purchase in a divisible blister card with a unique serial number shown on the back of the assay card. The yer-date of the coin will be random.
How should you decide whether to diversify beyond the Nifty 50?
SEBI’s investor guidance recommends considering diversification across different asset classes and matching investments to financial goals, risk tolerance and time horizon. It also warns that diversification cannot remove market-wide price volatility. Before changing a portfolio, assess the role and risks of each exposure rather than choosing it solely because it performed well in this one-year comparison.
- Time horizon: Consider when you will need the money. SEBI cautions against using risky investments such as equities for short-term needs and against volatile or illiquid investments when funds are needed soon.
- Risk type: Identify whether an exposure adds equity-market, interest-rate, credit, liquidity, currency or commodity-price risk. A different asset label does not mean the underlying risks disappear.
- Product details: For debt, examine duration, credit quality and liquidity. For overseas holdings, understand the geographic and currency exposure. For any fund or ETF, check holdings, costs, liquidity and tracking approach in its scheme documents.
- Personal suitability: No optimal allocation for every investor follows from the reported table or the equal-amount example. Consider your goals, capacity to bear losses and investment horizon before deciding whether a mix is appropriate.
SEBI states that investments of any kind are subject to risks. AMFI likewise says mutual fund schemes are not guaranteed or assured-return products, and past performance does not guarantee future performance. The 2026 figures show what diversification could have changed in one selected period—not what it will do in the next one.
Quick Recap
Product prices and availability are accurate as of the date/time indicated and are subject to change. Any price and availability information displayed on Amazon at the time of purchase will apply.




