Yes—Bitcoin crossed $100,000 in 2025, then later fell below it. Fidelity Digital Assets reported 53 consecutive daily closes above that threshold as of June 29, while a provider-specific historical series recorded a December 2025 monthly observation of $86,321.57. The year’s forecasts and chart indicators offered scenarios and reference points, not a guarantee that BTC would stay above $100,000.
What happened to Bitcoin’s $100,000 level in 2025?
Bitcoin did more than briefly touch $100,000: Fidelity Digital Assets said it had closed above the level for 53 consecutive days as of June 29, 2025. Fidelity reported a Q1 close of $82,560 and a Q2 close of $108,375 in its Q2 Signals Report.
That stretch above $100,000 did not last through the end of the year. Official Data’s historical monthly series recorded $118,648.93 for October 2025 and $86,321.57 for December. Those are observations from that provider’s series, not universal prices for every exchange or a definitive measure of the year’s peak.
So the historical answer is clear: BTC crossed and sustained daily closes above $100,000 for a time in 2025, but later traded below it. The answer to whether it can cross the threshold again in a future period depends on future market conditions; the 2025 data alone cannot establish that.
Free tools Windows power users keep installed
One-click scans. No signup required.
#1 Best Overall

- BITCOIN EXCLUSIVE, PHONE VERIFICATION: Bitkey is designed from the ground up exclusively for bitcoin — a dedicated hardware wallet for secure bitcoin storage. Approve transactions with a tap using your phone and NFC. No device screen is required.
- SELF-CUSTODY, NO EXCHANGE OR CUSTODIAN REQUIRED: You hold two of the three keys in the Bitkey system – one on your phone and one on your Bitkey device. The third is stored on Bitkey’s server and cannot move your bitcoin on its own.
- NO SEED PHRASE: Set up and use Bitkey without creating or storing a seed phrase.
- 2-of-3 MULTISIG: Three keys are stored separately across your phone, Bitkey device, and Bitkey’s server. Any two keys are required to move your bitcoin.
- BUILT-IN RECOVERY: Encrypted backup and recovery tools can help you regain access if you lose your phone or Bitkey device. You can also designate a Recovery Contact.
Why “hit $100K” needs a price definition
A threshold claim can refer to different things: an intraday trade, a daily closing price, or a monthly observation. Those are not interchangeable. Fidelity’s 53-day figure refers to consecutive daily closes; the Official Data figures are monthly-series observations. Neither should be described as a specific exchange’s intraday high.
There is no single official Bitcoin price. Bitcoin.org explains that independent markets can show different prices because they have different buyers, sellers, liquidity and local currencies. Its own price page is an aggregated reference, not an offer to transact. When comparing BTC figures, identify the provider, currency, period and price measure.
Rank #2

- Unparalleled Security: Protect your assets NDA-free EAL 6+ Secure Element, offering robust defense and complete transparency
- Simple & Secure Interface: Manage your digital assets easily with a clear OLED screen for secure on-device confirmations
- Supports 1000s of Coins & Tokens: Securely handle thousands of assets, including Bitcoin, Ethereum, and more, all in one wallet
- Effortless Asset Management: Monitor and transact seamlessly with Trezor Suite, our intuitive desktop and mobile app
- Enhanced Backup Solution: Rest assured with Multi-share Backup, eliminating single points of failure for secure cold wallet recovery
What were the major 2025 forecasts?
Forecasts differed in both format and horizon. The projections below were published expectations, not realized prices.
| Publisher and date | Forecast | Type and horizon | Context |
|---|---|---|---|
| Coin Metrics, 2025 outlook | $140,000–$170,000 | Projected test range during 2025 | The scenario assumed an MVRV z-score of 5–7 and corresponded to an estimated market capitalization of about $2.7 trillion–$3.3 trillion. These were scenario assumptions, not observed outcomes. |
| Standard Chartered, revised December 9, 2025 | $100,000 | Year-end 2025 point target | The bank cut its year-end target from $200,000. It also moved its $500,000 forecast to 2030. Geoffrey Kendrick, the bank’s global head of digital assets research, said, “Our previous near-term targets are wrong,” as reported by The Block. |
The forecasts should not be ranked as accurate or inaccurate without matching each target to the same date and price definition. A range for a possible intrayear test is not directly equivalent to a point estimate for the year-end.
Rank #3

- Unparalleled Security: Protect your assets with EAL 6+ Secure Element, offering robust defense and complete transparency
- Simple & Secure Interface: Manage your digital assets easily with a clear OLED screen for secure on-device confirmations
- Supports 1000s of Coins & Tokens: Securely handle thousands of assets, including Bitcoin, Ethereum, and more, all in one wallet
- Effortless Asset Management: Monitor and transact seamlessly with Trezor Suite, our intuitive desktop and mobile app
- Enhanced Backup Solution: Multi-share Backup eliminates single points of failure for secure cold wallet recovery
What did the charts suggest—and what can they establish?
Moving averages and realized-price references
Fidelity’s June 29, 2025 snapshot placed BTC above several reference levels it identified for that date. These are historical readings, not current support levels:
| Measure | Fidelity figure, June 29, 2025 | How to read it |
|---|---|---|
| 50-day simple moving average | $105,955 | A short-term trend reference calculated from recent prices. |
| 200-day simple moving average | $96,242 | A longer-term trend reference calculated from a broader price window. |
| Short-term realized price | $104,194 | A holder-cost reference for the short-term holder cohort, as reported by Fidelity. |
| Realized price | $48,056 | Fidelity’s estimate of holders’ average cost basis, based on the last price at which each token moved, with tokens presumed lost discounted. |
Fidelity also reported that BTC was 77.1% above realized price as of June 29, 2025, using an approximately $48,000 realized-price reference. These measures can help describe market position at a particular moment, but they do not guarantee that a price level will act as support. Moving averages change as new prices enter the calculation, and realized-price estimates depend on their methodology.
Rank #4

- Dual-chip architecture for maximum protection: The next-gen, fully auditable TROPIC01 chip works alongside a certified EAL6+ Secure Element—completely NDA-free—to deliver radically transparent, industry-leading defense against physical attacks.
- Quantum-ready security: Get protection against future threats with the first-ever hardware wallet designed with quantum-ready architecture.
- See every detail with confidence: Our largest high-resolution color touchscreen makes it easy to navigate your assets, review transactions and manage your coins with clarity.
- Wireless freedom with encrypted Bluetooth control: Manage, buy, swap and stake securely using Trezor Suite on desktop or mobile. Qi2-compatible wireless charging keeps your Trezor powered up. No cables required—security meets convenience.
- Works seamlessly with Android, iOS and desktop: Connect wirelessly or via USB-C to your phone or computer. Manage your crypto anywhere with our companion Trezor Suite app.
Long-term regression bands
The Bitcoin Rainbow Chart uses a logarithmic view of historical daily prices, a best-fit regression curve and fixed bands in log space. The bands show where price sits relative to a historical trajectory; they are not evidence that price must return to a particular band or reach a particular target. The chart’s methodology page, last updated July 12, 2026, explicitly cautions: “The Rainbow Chart should not be used as a timing signal, trading strategy, or price forecast.”
In practical terms, charts can help organize historical context and identify reference levels. They cannot establish that BTC will cross $100,000 again, when it might do so, or whether a crossing would hold.
Windows Errors? Fix Them Before They Spread
Repair common Windows errors and clear accumulated junk for a smoother, more stable PC - no reinstall needed.Free scan · no reinstallCrashes, No Sound, or Screen Glitches?
Random freezes, missing sound and display glitches usually trace back to one bad driver. Find and replace yours safely.Free scan · under a minuteQuick Recap
Best Value
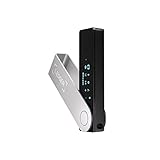
- Effortlessly build your crypto portfolio via the all in one Ledger Wallet app: buy, sell, send, receive, swap, stake and more across popular blockchains. 15,000+ coins & tokens in a single dashboard. Keep a close eye on the market. Compare service providers. Track performance. Get timely alerts. Build your portfolio with confidence.
- Effortlessly build your crypto portfolio via the all in one Ledger Wallet app: buy, sell, send, receive, swap, stake and more across popular blockchains. 15,000+ coins & tokens in a single dashboard. Keep a close eye on the market. Compare service providers. Track performance. Get timely alerts. Build your portfolio with confidence.
- Enjoy Bluetooth connectivity, iOS access, and hours of battery use with this mobile-first, secure backup signer. Freedom you can depend on.
- Genuine Check: confirm your signer is authentic during setup with the Ledger Wallet app.
- Protect your signer: keep it in mint condition at all times with a bespoke Pod or Case to avoid scratches and everyday wear and tear.
How to use these figures without treating them as a prediction
- Check the measure: distinguish an intraday touch from a daily close or a monthly data point.
- Check the source: independent exchanges and aggregators may report different prices.
- Date technical levels: a moving average or support reference from June 2025 is not a current level.
- Separate scenarios from outcomes: a forecast range or year-end target describes an expectation, not a market result.
- Do not infer timing from a long-term chart: historical regression bands describe prior price behavior, not a schedule for future moves.
Product prices and availability are accurate as of the date/time indicated and are subject to change. Any price and availability information displayed on Amazon at the time of purchase will apply.




