Recommended Free Tools
The best financial statement analysis tool depends on what you need to do. For research on a public company, start with its filed reports: use a spreadsheet for custom calculations, SEC datasets or APIs for structured access, and a financial data platform if you need to screen or compare many companies. SEC reporting software is for organizations preparing disclosures, not a default tool for individual investors.
What financial statements can tell you
A company’s financial statements are related views of its finances, not interchangeable reports. The balance sheet shows assets, liabilities, and equity at a point in time. The income statement and cash flow statement cover activity over a period. The statement of shareholders’ equity tracks changes in owners’ interests. The SEC’s Beginners’ Guide to Financial Statement explains these roles and emphasizes that no single statement tells the complete story.
Net income and cash flow are related but not equivalent. Footnotes explain accounting policies and significant judgments; management’s discussion and analysis (MD&A) describes management’s view of trends, uncertainties, and financial condition. Read them alongside the statements rather than treating a ratio or dashboard as a complete assessment.
Choose a tool for the work you need to do
| Tool category | Best suited to | What to check |
|---|---|---|
| Company filings and SEC resources | Reviewing public-company source documents | Reporting period, filing date and amendments, footnotes, MD&A, and issuer-specific XBRL tags |
| SEC datasets and APIs | Structured access and repeatable retrieval | Data cutoff, endpoint documentation, tag definitions, missing custom tags, amendments, and whether values match the filed report |
| Spreadsheet software | Custom ratios, trend tables, and scenario analysis | Formula checks, data-entry controls, auditability, and traceable source figures |
| Financial data platforms | Screening or comparing multiple companies | Issuer and geographic coverage, historical depth, standardized metric definitions, source links, export options, and current plan limits |
| SEC reporting software | Organizations preparing and managing regulated corporate disclosures | Filing workflow, XBRL support, collaboration controls, validation, and integrations |
For source-first company research: filings
For a public company, the filed report is the reference document. Find annual and quarterly reports through the SEC’s EDGAR search or the issuer’s investor-relations site. Check the period covered and whether a filing has been amended. If a structured-data value looks surprising, compare it with the filing, including its notes and relevant XBRL tags.
Quick wins for a faster PC:
Repair Windows errors before they cause bigger problemsFix Now →Fix the driver behind crashes, sound loss and screen glitchesFind Drivers →#1 Best Overall

- Profitability calculations; cash flow function Calculates NPV and IRR for uneven cash flows
- Time-value-of-money and Amortization keys solve problems including: pension calculations, loans, mortgages, etc.
- Ideal calculator for students, managers and statisticians
- Built-in functionality : List-based one- and two-variable statistics with four regression options: linear, logarithmic, exponential and power
- The BA II Plus calculator is approved for use on the following professional exams: Chartered Financial Analyst exam. GARP Financial Risk Manager (FRM) exam. Certified Management Accountants exam
For structured retrieval: SEC datasets and APIs
The SEC’s Financial Statement Data Sets contain selected information extracted from XBRL-tagged filings and are refreshed quarterly. The SEC warns that extraction errors can occur and that the datasets can omit information; they are intended to assist analysis, not replace full filings. Custom issuer tags, amendments, and differences in tag meaning can all affect comparisons. The SEC’s API documentation is the place to check current endpoints and access requirements.
For flexible calculations: spreadsheets
A spreadsheet gives you control over which periods, formulas, and assumptions to use. Microsoft Excel is one option; the appropriate choice depends on your existing workflow and needs. Keep a source reference beside each input, label periods consistently, and make formulas visible so you or another reader can retrace a result. Spreadsheet software does not verify that the figures you entered are comparable or correctly interpreted.
Rank #2

- PROFESSIONAL FINANCIAL CALCULATOR : Built-in TVM, IRR, NPV. Engineered for business analysts, real estate investors, accountants, and finance students.
- ADVANCED CASH FLOW & AMORTIZATION : Execute time value of money, break-even analysis, depreciation schedules, and bond pricing. Trusted for professional exam prep", MBA coursework, and banking certifications.
- CATIGA CF-300 : Flip-open hard case with a snap-close design for a secure fit. Compact and portable: designed for daily professional use in office, classroom, or on-site.
- ALL-IN-ONE FOR PROFESSIONALS : From NPV/IRR for real estate analysis to statistical calculations for business analysts. Handles probability, linear regression, and complex financial formulas.
- MORTGAGE, LOAN & INVESTMENT CALCULATOR : Covers bond pricing, loan amortization, investment analysis, and exam-level computations. Your go-to accounting calculator, business calculator, and real estate calculator in one device.
For screening several companies: financial data platforms
A dedicated platform can make it easier to filter and compare companies, but its standardized figures are not a substitute for checking important values against filings. Koyfin positions itself as a financial data analysis platform. Before relying on any platform, verify that it covers the companies and markets you need, shows sufficient history, explains its metric definitions, links to sources, and supports your export workflow. Current coverage and plan limits should be checked with the vendor.
For preparing disclosures: SEC reporting software
Tools designed for SEC reporting address corporate disclosure workflows rather than ordinary personal investing. Workiva’s SEC reporting software is an example of this category. An individual analyzing a company generally does not need filing-preparation software.
Free tools Windows power users keep installed
One-click scans. No signup required.
Rank #3
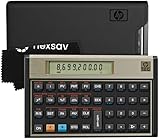
- HP 12C: INDUSTRY STANDARD SINCE 1981 – Trusted by professionals in real estate, banking, and finance for over 40 years. The HP 12C finance calculator remains the go-to tool for fast and accurate calculations in high-stakes business environments.
- 120+ FUNCTIONS FOR FINANCIAL ANALYSIS – Calculate loan amortization, bond pricing, mortgage payments, NPV, IRR, depreciation, and more with this large calculator. Built-in business and statistical functions allow you to perform complex calculations in just a few keystrokes.
- RPN ENTRY FOR FASTER WORKFLOWS – Reverse Polish Notation (RPN) allows for efficient data entry with fewer keystrokes and no formulas. This RPN calculator is perfect for a mortgage payment calculator, accounting calculator, business calculator, or real estate calculator for desktop.
- PROGRAMMABLE FOR REPEAT TASKS – The HP12C desk calculator stores custom keystroke sequences for repeated use. This large calculator supports up to 20 cash flows for IRR/NPV analysis, modeling investment scenarios, projecting returns, and automating routine calculations.
- INCLUDES CLEANING CLOTH, CASE & BATTERIES – Compact design fits easily on a desk or crowded table area. Includes a protective carrying case, cleaning cloth, and comes with pre-installed batteries so it's ready to use out of the box. A great choice for home finances, business professionals, and accountants.
How to compare financial statement analysis tools
Do not rank a spreadsheet, a filing database, and disclosure software as if they solve the same problem. Compare tools against your workflow using these criteria:
- Source traceability: Can you get from a displayed figure back to the filing, period, and underlying definition?
- Coverage and history: Does it cover the issuers, regions, and time span you need?
- Statement detail: Can you inspect all four statements, footnotes, and MD&A where relevant?
- Comparability: Are reporting periods and metric definitions consistent across the companies you are comparing?
- Workflow: Can you export data or move it into your spreadsheet, and do you need collaboration or filing controls?
- Cost and limits: Confirm current pricing, plan restrictions, and data entitlements directly with the vendor before paying.
No independent, like-for-like price or feature comparison is established here, so these products should not be treated as a tested ranking.
Rank #4

- HP 10BII+ FOR STUDENTS & PROFESSIONALS – This HP calculator is built for business, finance, accounting, and statistics courses. Perfect for learners and professionals who need to solve common financial problems quickly without memorizing formulas or relying on spreadsheets.
- 100+ FUNCTIONS FOR REAL WORLD MATH – Quickly solve time value of money, interest rates, loan payments, NPV, IRR, cash flows, and more. The 10bII+ also includes probability distributions for statistics courses—a feature not often found in financial calculators.
- ALGORITHMIC INPUT WITH DEDICATED KEYS – This high-school/college calculator uses algebraic and chain logic with minimal keystrokes. Layout appears the same as standard calculators for easy learning. Dedicated keys give quick access to commonly used financial and statistical functions
- APPROVED FOR MAJOR EXAMS – The HP 10bII+ algebra calculator is permitted for use on SAT, PSAT/NMSQT, and AP tests. An ideal statistics calculator and business calculator for school finance and accounting students preparing for class, coursework, or standardized exams.
- INCLUDES TRAVEL CASE, CLEANING CLOTH & BATTERIES– Slim, durable, and easy to keep on hand or store in a backpack or locker. Includes a protective case, cleaning cloth, and batteries so it’s ready out of the box. Large screen with clear contrast (non-backlit) is easy to read during exams or lectures.
A practical workflow for analyzing a company
- Locate the latest annual and quarterly reports. Use SEC EDGAR or the issuer’s investor-relations site. Note the reporting period, filing date, and any amendments.
- Review all four statements. Keep the balance sheet’s point-in-time figures distinct from income-statement and cash-flow activity over a period; also review changes in shareholders’ equity.
- Read the notes and MD&A. Look for accounting policies, significant judgments, management’s explanation of trends, uncertainties, and financial condition.
- Build a period-by-period view. Use a spreadsheet or structured data to compare multiple periods. For company-to-company comparisons, favor businesses with similar models and check that the selected tool uses comparable periods and definitions.
- Calculate ratios only after checking the inputs. For example, operating margin is income from operations divided by net revenues; inventory turnover is cost of sales divided by average inventory. Confirm the exact line items and calculation convention before comparing results.
- Verify material values against the filings. If an SEC dataset or platform presents an unclear or unexpected figure, trace it to the filed report and relevant tags or notes.
How to interpret ratios responsibly
A ratio is a prompt for investigation, not a verdict on a company. Definitions can differ, and the SEC notes in its investor guide that desirable ratios vary by industry. Compare like periods, check the underlying statement items, and account for the company’s accounting context before drawing conclusions. A screening tool can help find patterns; it cannot make unlike businesses directly comparable by itself.
Quick Recap
Product prices and availability are accurate as of the date/time indicated and are subject to change. Any price and availability information displayed on Amazon at the time of purchase will apply.




