When evaluating coatings and sealants companies, compare what they sell and who buys it, then test how that mix translates into segment growth, profitability, cash flow, and risk. RPM International is a useful example of why the details matter: its three reporting groups serve different markets, and it changed its segment structure in 2025, making unreconciled year-over-year comparisons misleading.
Start with products, customers, and end markets
Companies described as coatings or sealants businesses can have very different economics. One may focus on consumer paints; another may sell protective coatings to industrial customers, roofing systems to contractors, or repair products for infrastructure. Compare the applications and buyers, not just the industry label.
RPM’s FY2026 Form 10-K says its subsidiaries make and sell specialty paints, infrastructure rehabilitation and repair products, protective coatings, roofing systems, sealants, and adhesives for construction, industrial, specialty, and consumer markets. That is the company’s own description, not an independent assessment. RPM International Inc., FY2026 Form 10-K
- Product families: Identify whether sales come from coatings, sealants and adhesives, roofing, repair systems, or adjacent products and services.
- Applications: Distinguish maintenance and repair demand from new construction, and industrial applications from consumer projects.
- Buyers and routes to market: Check reliance on distributors, contractors, direct sales, retailers, and end users. A company’s channel mix can shape both customer concentration and exposure to demand swings.
- Demand drivers: Compare how construction activity, industrial investment, infrastructure spending, and consumer demand affect each company’s product mix.
Read RPM’s segments using the current reporting structure
Effective June 1, 2025, RPM realigned its reporting structure to three reportable groups. In fiscal 2026, its approximate net-sales mix was 39% Construction Products Group (CPG), 27% Performance Coatings Group (PCG), and 34% Consumer. These are RPM-reported proportions for that fiscal year, not market-share figures. RPM International Inc., FY2026 Form 10-K
#1 Best Overall

- CERAMIC COATING FOR CARS: Delivers an extremely glossy, mirror-like finish on clean paint. Use as a standalone paint sealant or as a quick ceramic topper that deepens color and adds slickness. Not a one-step miracle coating and not a paint corrector
- 50-WASH CERAMIC PROTECTION: A true ceramic paint sealant, tested to a 50-wash durability rating for months of protection. Seals and shields your paint so it stays slick and beads water long after ordinary spray waxes have washed off
- CERAMIC SPRAY WAX ALTERNATIVE, QUICK AND EASY: Wash and dry first, then spray a thin, even coat onto one panel at a time and buff immediately. A thin, even coat ensures optimal bonding and maximum gloss
- EXTREMELY HYDROPHOBIC: True ceramic technology repels water, road grime, mud, and dirt, so your car stays cleaner between washes and rinses clean faster. Use on cars, trucks, SUVs, RVs, boats, and motorcycles
- ULTRA SLICK SURFACE: An extremely smooth finish that is safe for all paint colors and clear coats, so the surface stays slick to the touch and dirt has less to grab onto between washes
| RPM group | Approximate share of FY2026 net sales | What it includes |
|---|---|---|
| Construction Products Group (CPG) | 39% | Construction products and services, including sealants and adhesives, roofing, concrete repair, building-envelope solutions, weatherproofing, and restoration services. |
| Performance Coatings Group (PCG) | 27% | High-performance flooring, corrosion-control and fireproofing coatings, infrastructure repair, factory-applied industrial coatings, and related specialty lines. |
| Consumer | 34% | Rust-preventative, special-purpose, and decorative paints; caulks, sealants, primers, cleaners, and woodcare products. |
The prior fiscal year used four reportable segments. RPM’s FY2025 sales mix was approximately 38% CPG, 20% PCG, 33% Consumer, and 9% Specialty Products Group. RPM transferred businesses among groups effective June 1, 2025, so the apparent mix changes are not, by themselves, evidence of organic growth or decline. Reconcile the reporting structures before comparing periods. RPM International Inc., FY2025 Form 10-K and RPM International Inc., FY2026 Form 10-K
Compare segment growth and profitability, not just total revenue
Consolidated sales can obscure diverging results among a company’s businesses. Compare each segment’s sales growth, operating margin, and contribution to the total over several years. Then separate organic growth from acquired growth and account for changes in segment definitions.
Rank #2
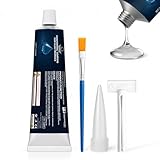
- Conformal Coating for Electronics: The insulation conformal coating sealant provides sealing and insulation functions for electronic components, resisting moisture, dust and humidity, protecting circuits and ensuring stable operation
- Reliable Barrier: After curing, the silicone conformal coating forms a flexible, invisible protective layer on the surface, which is waterproof, corrosion-resistant, and wear-resistant, extending the life of components
- Insulation Reinforcement: The insulation conformal coating fits the components tightly without cracking, is resistant to high and low temperatures, and providing insulation protection for components during temperature fluctuations to achieve long-term electronic stability
- Simple Operation: After cleaning the surface, apply the conformal coating for electronics evenly to the part that needs to be sealed or bonded, and wait for it to cure. (5-8 hours for the initial stage, 24 hours for full curing)
- Widely Used: Insulation conformal coating are commonly used in circuit boards, electronic components, control boards, etc., and have good adhesion to most metal and non-metal materials, making them an ideal partner for repair and electronics enthusiasts
- Use matching fiscal periods and consistent definitions across companies.
- Check whether reported growth reflects volume, pricing, acquisitions, divestitures, currency, or a reorganization of reportable segments.
- Compare margins on the same basis. If a company provides adjusted measures, keep them separate from reported figures and examine the reconciliation.
- Look for whether segment growth is translating into stronger operating performance, rather than assuming that faster sales growth means better economics.
The available RPM figures establish the company’s sales mix, not a peer ranking or comparative profitability assessment. To compare margins or growth, use the latest filings and results for each company and align the measures before drawing conclusions.
Assess customer concentration, channels, and geographic exposure
Customer concentration can make results more sensitive to the decisions of a single buyer. RPM disclosed that its largest customer accounted for 20% of Consumer segment net sales in fiscal 2026. This is a segment-level concentration figure, not 20% of RPM’s company-wide sales. RPM International Inc., FY2026 Form 10-K
Rank #3

- UNSURPASSED SLICKNESS – You simply have to touch it to believe how slick this finish is.
- MAXIMUM GLOSS AND SHINE – Hands down the highest level of gloss and shine you will ever experience. Achieve mirror-like results in a simple application, right in your own driveway.
- QUICK AND EASY TO APPLY - Simply wash and dry your vehicle as you normally would. Then evenly spray a light coat directly to a panel or small area of your vehicle., then, just lightly buff the coating to an incredible shine! It really doesn't get any easier than this!
For RPM and any peer, examine disclosures about major customers, distribution partners, and sales channels, including whether a concentration relates to one segment or the whole company. Also distinguish broad geographic reach from demonstrated resilience: RPM reported that it marketed products in approximately 167 countries and territories and operated manufacturing facilities at approximately 120 locations as of May 31, 2026. Those scale figures do not establish market share or relative performance. RPM International Inc., FY2026 Form 10-K
Test financial quality and capital allocation
Revenue growth matters only insofar as it supports durable earnings and cash generation. Compare several years of reported results and examine how the company funds operations, investment, acquisitions, and shareholder returns.
Rank #4

- LONG-LASTING PROTECTION - SiO2 ceramic polymers create a durable barrier against corrosion, pitting, and salt damage, ensuring your metals stay pristine
- EASE OF MAINTENANCE - Repels water, dirt, and grime, making cleaning a breeze and keeping surfaces looking new with less effort
- VERSATILE APPLICATION - Ideal for pontoons, trailers, towers, and all raw or polished metals, offering a one-stop solution for metal care
- WATER REPELLENCY - Enhances water resistance, ensuring surfaces dry faster and remain clear of water spots and buildup
- UV RESISTANCE - Blocks damaging UV rays, protecting surfaces from the sun's harsh effects and prolonging the life of your metals
- Margins and cash conversion: Review gross and operating margins alongside operating cash flow and cash conversion. Note whether working-capital needs or one-off items affect the trend.
- Debt and liquidity: Compare debt, cash, liquidity, and the ability to meet obligations using the same reporting date and definitions for each company.
- Returns on capital: Consider whether acquisitions and investment in research, capacity, or other priorities produce attractive operating outcomes over time.
- Capital allocation: Track acquisitions, integration, dividends, repurchases, and investment plans. Treat management’s stated priorities as claims to test against subsequent financial results.
For investment decisions, company analysis is only part of the work: valuation also depends on the current share price and comparable valuation measures. The company figures above do not establish whether RPM or any peer is attractively valued.
Independent reader supportYour contribution helps us test, update, and keep practical guides available for everyone.Compare risks that can affect durability
Do not assume that every coatings and sealants company has the same risk profile. Compare the specific exposures disclosed by each business and consider whether they are material to its products, operations, or customers.
Quick Recap
Best Value

- ProtectaClear is a clear, protective coating that is specially formulated to protect high-use metal surfaces from tarnish, oxidation, and even fingerprints. It is easy to apply and leaves a hard, durable finish that is practically invisible. Keeps your metal surfaces looking new for years to come. Perfect for use on jewelry, silver, stainless steel, sinks & many other polished metal surfaces, ProtectaClear is a must-have for anyone looking to preserve the appearance and value of their metal.
- A 4 oz. can of ProtectaClear will seal & protect about 25 square feet of metal with 1 coat. Many projects require multiple coats for long-lasting protection.
- Protect plated or polished metals, seal jewelry and stop skin allergies. Make your jewelry hypoallergenic. Preserve Patinas from fading. Excellent adhesion even on mirror-polished metals.
- Easy to Apply. Dip, spray, brush or wipe on. Brush marks will self-level.
- Unsure what you need? Click on Flowchart image for help.
- Raw-material and energy costs, including the company’s ability to manage cost changes.
- Environmental and product regulation, litigation, and other legal exposures.
- Competition and the possibility that customer or channel concentration magnifies volatility.
- Construction and industrial cyclicality, as well as operational and geographic complexity.
- Acquisition integration risk, especially where business transfers or acquisitions complicate comparisons.
Use a consistent comparison process
- Map the business: List each company’s major product families, applications, customer types, channels, and end markets.
- Align segment data: Use the latest segment definitions, reconcile reorganizations, and separate acquired from organic growth where the company reports it.
- Compare operating results: Review segment and consolidated growth, margins, cash generation, debt, liquidity, and returns on capital using matching periods and accounting bases.
- Check concentration and reach: Identify major-customer or channel dependencies and compare geographic exposure and operations without treating scale as proof of resilience.
- Evaluate strategy and risk: Test stated priorities and investment choices against financial outcomes, and compare the company-specific risks disclosed in filings.
- Assess the investment separately: Add current price and valuation measures before deciding whether a company’s operating profile is reflected in its shares.
Product prices and availability are accurate as of the date/time indicated and are subject to change. Any price and availability information displayed on Amazon at the time of purchase will apply.




