Quick wins for a faster PC:
Scan for outdated or missing drivers - takes under a minuteDriver Scan →Clear out junk files and repair common Windows errorsFree Scan →Gold and silver prices move as markets continuously reassess interest rates, currencies, economic growth, uncertainty, investor positioning and physical demand. Several of these forces can pull in opposite directions on the same day, so no single indicator reliably explains every move—or predicts the next one.
What moves gold prices from day to day?
The World Gold Council (WGC) groups gold’s price drivers into four connected themes: economic expansion, risk and uncertainty, opportunity cost, and momentum. They are useful lenses for interpreting a move, not a formula for forecasting it. Gold is a global asset, so international developments matter alongside US interest rates and the US dollar.
Economic expansion
Stronger economic activity can support demand for gold jewelry, technology uses and long-term savings. But growth can also change expectations for interest rates and currencies, which may affect gold in a different direction. The net effect depends on which channels markets focus on.
Risk and uncertainty
Political or financial uncertainty can increase interest in gold as a potential hedge or portfolio diversifier. That does not mean gold rises every time uncertainty increases: other market forces may offset the demand, and investors may respond differently to different events.
The Tool Desk
Outbyte Driver Updater FREEFix the driver behind crashes, sound loss and screen glitchesFind Drivers →Outbyte PC Repair FREEClear out junk files and repair common Windows errorsFree Scan →#1 Best Overall

- ✔️1 oz 2026 American Silver Eagle Coin
- ✔️Obverse: Adolph A. Weinman’s design of Lady Liberty wrapped in the American flag and elegantly striding over a ridge while the sun rises.
- ✔️Reverse: One eagle flying into land while carrying an oak branch in its talons.
Opportunity cost: yields and currencies
Gold does not pay interest. When bond yields fall, holding gold may look relatively more attractive; when yields rise, interest-bearing assets may become more appealing. Currency movements matter too. A weaker US dollar can support gold priced in dollars, while a stronger dollar can weigh on it. These relationships are tendencies, not guarantees, and the relevant yield or currency may vary by market and time frame.
Momentum and positioning
Investor flows and market positions can reinforce a price trend or contribute to a reversal. Exchange-traded fund (ETF) flows, futures positioning and options activity can change more quickly than physical supply and demand. A sharp move may therefore reflect both a change in investors’ expectations and the trading activity that follows.
Rank #2

- Purity: .999 Fine Silver
- Diameter: 40.6 mm; Thickness: 3.2 mm
- Stock Photo; Image is indicative of quality
- Metal Content: 1 Troy Ounce per Coin; Total: 5 Troy Ounces
- You will receive five coins per purchase; DISCLAIMER: Please note that we pull random year coins from the same tube, so all coins received per purchase will be from the same year— mixed bags are highly unlikely, ensuring a consistent and uniform collection for your enjoyment!
What recent gold data can—and cannot—tell you
The WGC’s H1 2026 Gold Return Attribution Model (GRAM) assigned 17% of measured gold-price variability to risk and uncertainty, 14% to foreign exchange (FX), 3% to rates, 24% to momentum, and 30% to other factors. This model used monthly data over a five-year estimation period, with data through 26 June 2026. These are model-specific shares of variability for that period—not universal causal weights, daily sensitivities or a forecast of what will drive the next move. See the WGC’s 2026 mid-year outlook.
Quarterly figures offer broader context, but cannot identify the cause of a particular day’s price change. For Q2 2026, the WGC reported 44.8 tonnes of gold ETF outflows and 288.9 tonnes of central-bank purchases. Total gold demand was 1,268.9 tonnes. The average LBMA Gold Price PM was US$4,506.3 per ounce—8% below Q1 2026 and 37% above Q2 2025. The quarter ended 30 June 2026. These figures show that different sources of demand and investment flows can move in different directions at once; they do not establish which one drove a daily price move. Read the WGC’s Q2 2026 Gold Demand Trends report.
Rank #3

- Purity: .999 Fine Silver
- Diameter: 40.6 mm; Thickness: 3.2 mm
- Stock Photo; Image is indicative of quality
- Metal Content: 1 Troy Ounce per Coin; Total: 10 Troy Ounces
- You will receive ten coins per purchase; DISCLAIMER: Please note that we pull random year coins from the same tube, so all coins you receive will be from the same year— mixed bags are highly unlikely, ensuring a consistent and uniform collection for your enjoyment!
A separate example shows how short-term forces can coincide. The WGC said gold’s rally in August 2026 was helped by ETF inflows, increased net long futures positions, call options and a weaker US dollar. Gold rose 13.3% in USD terms that month, ending August at US$4,563 per ounce, based on data through 31 August. This is historical context, not a current quote or proof that any one factor caused the whole return. Read the WGC’s August 2026 commentary.
Why silver moves—and how it differs from gold
Silver’s price also responds to changing combinations of rates, currencies, investment positioning, its relationship with gold, and demand for physical uses such as jewelry, technology and industry. The mix can change over time; the available evidence does not establish a current ranking of silver’s daily drivers or a current percentage for industrial demand.
Rank #4
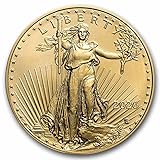
- ✔️Each coin contains 1/10 oz of gold.
- ✔️Obverse: Lady Liberty holding a torch with an olive branch.
- ✔️Reverse: Portrait with an American bald eagle, a design by Jennie Norris in 2021.
- ✔️Each Gold Eagle is a sovereign monetized bullion coin fully guaranteed by the U.S. Mint.
The Silver Institute’s December 2024 report describes silver as being influenced by multiple factors whose effects vary. It notes that falling nominal rates—and especially real rates falling to negative levels after the Global Financial Crisis—supported silver prices, partly through higher gold prices. This supports watching real-rate expectations and gold’s direction as context, but not treating either as a complete explanation of silver’s daily moves. Read the Silver Institute report, Factors that Determine the Silver Price.
When comparing the metals, consider the same market context for both: yields and currencies, investor flows and positioning, gold-silver co-movement, and physical-use demand. The sources cited here support a qualitative comparison, not a current numerical ranking of those influences. Avoid assuming silver always moves in the same direction as gold, or that industrial demand alone determines its short-term direction.
Free tools Windows power users keep installed
One-click scans. No signup required.
Best Value

- Purity: .999 Fine Silver
- Diameter: 40.6 mm; Thickness: 3.2 mm
- Metal Content: 1 Troy Ounce per Coin; Total: 10 Troy Ounces
- Stock Photo; Image is indicative of quality
- You will receive ten coins per purchase; DISCLAIMER: Please note that we pull random year coins from the same tube, so all coins received per purchase will be from the same year— mixed bags are highly unlikely, ensuring a consistent and uniform collection for your enjoyment!
How to interpret a price move
Before deciding what a headline or chart says about gold or silver, establish what price it is showing and what else changed around the same time.
- Check the timestamp. Note the date and time, including the relevant time zone. A live quote, a market close and a monthly or quarterly average describe different intervals.
- Identify the currency and unit. Confirm whether the quote is in US dollars or another currency, and whether it is per troy ounce or another unit. Currency changes can alter the price a buyer sees outside the quote’s currency.
- Identify the price measure. Spot prices, futures prices and benchmark prices such as the LBMA Gold Price PM are distinct series. Do not treat them as interchangeable.
- Look at rates and currencies together. Ask whether relevant bond yields and the US dollar moved, while remembering that neither relationship guarantees a particular metal-price response.
- Check investor activity and broader context. ETF flows, futures positioning and options can help explain short-term momentum; quarterly demand, central-bank purchases and supply data provide a wider—but less day-specific—picture.
- Compare multiple possible explanations. If one factor points up and another points down, that is not a contradiction: prices reflect the balance of expectations and activity, not a single input.
The WGC’s data hub provides gold spot prices, futures, volatility, trading volumes, demand and supply data, ETF flows and futures positioning, with update dates shown on the site. Use the date attached to a dataset when comparing it with a price move; the figures do not necessarily update on the same schedule.
Quick Recap
Product prices and availability are accurate as of the date/time indicated and are subject to change. Any price and availability information displayed on Amazon at the time of purchase will apply.




