Quick wins for a faster PC:
Scan for outdated or missing drivers - takes under a minuteDriver Scan →Repair Windows errors before they cause bigger problemsFix Now →Fix the driver behind crashes, sound loss and screen glitchesFind Drivers →Compare consumer goods stocks with companies that have similar business models, then test whether dividends are supported by cash and whether valuation makes sense for the cash the business can generate. A high yield or low valuation multiple alone does not establish that a stock is attractive.
Start with companies that have comparable business models
Consumer staples companies make or sell recurring-use goods, but a branded-products manufacturer and a grocery retailer do not have the same economics. Their margins, capital requirements and cash-conversion patterns can differ substantially. Compare a company first with businesses operating the same way, then use broader sector context. Kiplinger’s consumer staples overview is useful for sector scope, not as a basis for treating every company in the category as a direct peer.



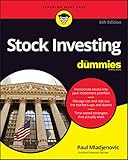
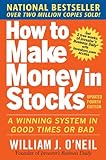
Within a peer group, compare revenue and margin growth, capital spending, debt and interest burden, and working-capital behavior. For retailers, inventory levels and supplier payables can materially affect cash generation. For branded manufacturers, consider input costs, pricing and changes in brand or product mix. These differences help explain why two companies with similar headline yields or valuation multiples may have different financial risks.
Judge the dividend by its funding, not its headline yield
Dividend yield is the annual dividend per share divided by the share price. Because the price changes, a yield is meaningful only when dated; it can rise because a share price has fallen, even if the dividend has not changed. Yield also says nothing by itself about whether the company can keep paying.
#1 Best Overall
Assess the dividend as a cash commitment using several measures together:
- Earnings payout: Compare dividends with earnings, while recognizing that reported earnings are not cash available for distribution.
- Free-cash-flow coverage: Compare dividends with cash remaining after capital expenditures. A dividend that repeatedly exceeds this cash flow may depend on borrowing, asset sales or other sources.
- History and policy: Review dividend growth and cuts over several years, but treat continuity as historical evidence rather than a promise.
- Debt and priorities: Consider debt obligations, interest costs and management’s stated capital-allocation order alongside distributions.
Target’s FY2025 Form 10-K ranks profitable reinvestment and maintaining operations first, maintaining and seeking to grow the dividend second, and excess-cash share repurchases third, subject to credit-rating goals. That sequence shows why dividend coverage should be considered alongside business investment and balance-sheet constraints. Kroger’s FY2026 Form 10-K describes dividend growth as subject to board approval and discusses excess free cash flow. Neither company’s stated policy guarantees future payments; dividends remain subject to company circumstances and board decisions.
Compare valuation using the same date and financial basis
A valuation multiple is useful only in context. Compare companies on a common share-price date and specify the fiscal period and whether figures are trailing actuals or forward estimates. Use more than one lens—for example, price-to-earnings (P/E) and enterprise value to EBITDA (EV/EBITDA)—and include a cash-flow measure such as free-cash-flow yield or a transparent discounted-cash-flow analysis.
Explain differences rather than treating a discount as a buy signal. Growth expectations, margins, leverage, business mix and risk can all affect what investors are willing to pay. A retailer and a branded manufacturer may warrant different comparisons even when both are classified as consumer staples. The company filings discussed here do not establish a consistent, dated peer valuation table, so they do not support naming a currently cheapest stock.
Read cash flow with investment and working-capital changes
Operating cash flow is not the same as free cash flow. Read it alongside capital expenditures, which are cash invested in property and equipment; free cash flow is commonly calculated as operating cash flow minus capital expenditures. Also inspect working-capital movements, particularly inventory and accounts payable, because purchase timing and supplier-payment timing can shift reported cash generation between periods.
Target’s FY2025 Form 10-K attributes lower operating cash flow in part to lower net earnings and the net effect of lower accounts-payable leverage and inventory purchases. The example illustrates why one year’s free-cash-flow figure can be misleading when separated from earnings and working-capital movements. When comparing peers, distinguish a persistent decline in cash generation from period-to-period timing effects, and examine more than one fiscal period.
Rank #4
Connect dividend sustainability, cash generation and valuation
The measures work best as a chain. A company needs cash after necessary investment to support recurring distributions; its valuation should then be judged against the cash it can plausibly generate over time. If the dividend appears well covered by earnings but not by cash after capital spending, investigate the gap. If a stock trades at a lower multiple than peers, ask whether weaker growth, margins, balance-sheet strength or greater business risk helps explain the difference.
Company filings report dividends for defined fiscal periods, not current market yields. For example, Hershey’s FY2025 Form 10-K reports period-specific cash dividends paid and an annual per-share dividend rate. Those disclosures can help verify what the company paid or declared for that fiscal period, but they are not a current yield or a peer valuation comparison.
The Tool Desk
Outbyte Driver Updater FREEScan for outdated or missing drivers - takes under a minuteDriver Scan →Outbyte PC Repair FREEClear out junk files and repair common Windows errorsFree Scan →A practical comparison checklist
- Choose a coherent peer group. Separate retailers from manufacturers, then narrow peers by business model.
- Record the date and basis. Date each share price and yield; label valuation inputs as trailing or forward and identify the fiscal period.
- Test the distribution. Compare the dividend with earnings and free cash flow, and review multi-year changes, debt and company policy.
- Trace cash generation. Read operating cash flow with capital expenditures, inventory and payables movements, and multiple fiscal periods.
- Explain valuation differences. Use at least two multiples and a cash-flow lens; relate any premium or discount to growth, margins, leverage, business mix and risk.
Target, Kroger and Hershey illustrate how companies disclose dividend policy, cash flow and fiscal-period payments. Their filings do not establish a current ranking or recommendation among consumer goods stocks.
Quick Recap
Product prices and availability are accurate as of the date/time indicated and are subject to change. Any price and availability information displayed on Amazon at the time of purchase will apply.




