In March 2024, Perth’s median house sale price reached a reported record of $620,000, up 2.5% from February. Yangebup had the biggest reported monthly increase among the suburbs in PerthNow’s list, followed by Camillo, Beeliar, Mount Pleasant and Belmont. These are historical March 2024 figures, not current Perth prices.
Perth’s March 2024 median house sale price
Real Estate Institute of Western Australia (REIWA) data, as reported by PerthNow on 5 April 2024, put Perth’s median house sale price at $620,000 in March 2024, a 2.5% increase over February. The report described it as a record at that time. This is a median of house sale prices, not an average asking price or a valuation estimate. PerthNow’s report of the REIWA data also said unit sale prices rose 1.2% over the month.

![[By Gary Keller] The Millionaire Real Estate Agent: It's Not About the Money.It's About Being the Best You Can Be!-[Paperback] Best selling books for |Real Estate Investments (Books)|](https://m.media-amazon.com/images/I/51VRMo4zfbL._SL160_.jpg)
Which Perth suburbs had the biggest house price increases in March?
The following is the March monthly ranking reported by PerthNow, based on changes in house median sale prices. It is not a year-on-year or financial-year ranking.
| March monthly rank | Suburb | Reported increase | Resulting median house sale price |
|---|---|---|---|
| 1 | Yangebup | 4% | $644,500 |
| 2 | Camillo | 3.5% | $445,000 |
| 3 | Beeliar | 3.4% | $695,000 |
| 4 | Mount Pleasant | 3.3% | $1,550,000 |
| 5 | Belmont | 3.2% | $590,000 |
The figures describe one month’s movement in suburb medians. A median can change as the mix and number of homes sold changes; the report does not provide suburb-level sample sizes or uncertainty estimates. The ranking therefore does not establish that a suburb’s prices will keep rising or that it will deliver stronger investment performance.
Do these 3 things before closing this tab:
1Clear out junk files and repair common Windows errors2Fix the driver behind crashes, sound loss and screen glitches3Repair Windows errors before they cause bigger problems#1 Best Overall
Why the monthly ranking differs from the annual leader
Time period matters when comparing price-growth lists. REIWA’s report for the 2023–24 financial year named Viveash as the leader in annual house median sale price growth: its median rose 40.9% to $620,000. That is a different measure and period from the March monthly list. REIWA reported Perth’s annual median house sale price at $665,000 for the year to June 2024. REIWA’s 2023–24 top-performers report covers that financial-year comparison.
Other Perth market figures reported for March 2024
PerthNow reported that active listings stood at 3,654 at the end of March 2024, down 8.9% from February and 48.7% from March 2023. It also reported a median weekly rent of $649, up 3% over the month and 18% year on year. These figures describe the market at that time and should not be read as current conditions.
Rank #2
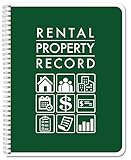
- This Wire-O book contains spaces for you to keep track of tenants, performed and upcoming maintenance, income & expense per property, etc.
- There is enough space for landlords and property managers to track 5 rental properties and 34 tenants
- 100 Pages, Wire-O, 8.5" x 11" - Reorder SKU: LOG-100-7CW(RentalProperty
- Made in USA, Proudly Produced in Ohio. Veteran-Owned.
- Made in the USA: Proudly produced in Ohio by a veteran-owned business; commitment to quality and American craftsmanship
The report attributed price pressure to demand exceeding supply and population growth. REIWA chief executive Cath Hart said WA population growth continued at near-record rates and created strong competition for homes. Those are the explanation and comments presented in the report, rather than a separate causal analysis here.
Hart also said: “We’ve seen house prices increase 12.7 per cent year-on-year, while unit prices are up 5 per cent,” she said. She added: “Local buyers are often more emotional. They may have a preference for a certain suburb or fall in love with a home and be willing to pay a premium price.”
Recommended Free Tools
Quick Recap
Best Value

- Used Book in Good Condition
Rank #4

- SPECIALLY DESIGNED FOR FIREARMS DEALERS & COLLECTORS: Skyline Firearms Record Book is designed for the specific needs of firearms dealers and collectors and follows all ATF standards for recording firearms transactions.
- DETAILED ACQUISITION & DISPOSITION RECORDS: This gun record book comes in a large format (10 by 7 inches) and allows you to keep clear and detailed records of firearms acquisition and disposition.
- 915 ENTRIES TOTAL & LARGE FORMAT: This firearm log book has 129 pages to add up to 915 transaction records. You can use the front page to add information about your dealership and empty pages at the back to store extra information.
- VINTAGE DESIGN & PREMIUM MATERIALS: This firearm record book has a durable eco-leather hardcover with an elegant engraving, heavy-duty 120gsm paper, lay-flat binding, elastic, pen loop, bookmark, and pocket for notes.
- 60-DAY MONEY-BACK GUARANTEE - We will exchange or refund your book of firearms if you aren’t satisfied with your log book for any reason. Reach out to us via message to refund your gun log book.
How to use this ranking
- Check the period: the suburb table compares March with February 2024, while Viveash’s 40.9% increase is for the 2023–24 financial year.
- Check the property type and measure: the table concerns house median sale prices, not unit prices, asking prices or valuations.
- Do not treat the list as a current-market guide. The figures are historical, and no October 2026 suburb ranking is established here.
Product prices and availability are accurate as of the date/time indicated and are subject to change. Any price and availability information displayed on Amazon at the time of purchase will apply.




