Free tools Windows power users keep installed
One-click scans. No signup required.
For a U.S. farmer assessing corn, soybean, and wheat markets in August 2025, the key was to track five connected signals: USDA’s crop-size estimates, crop condition and remaining yield risk, projected supply and ending stocks, export demand and shipments, and the relationship between futures and local cash bids. The figures below are USDA estimates or forecasts available at the time—not current market data or a prediction of any individual farm’s yield or price.
1. What crop size do USDA’s acreage and yield estimates imply?
Production is shaped by both the area harvested and the yield per acre. A change in either can alter expected national supply, but a national forecast is not a guarantee of what any farm will harvest.
In its August 12, 2025 crop report, USDA’s National Agricultural Statistics Service (NASS) forecast U.S. corn production at 16.7 billion bushels, 13% above 2024, and average yield at 188.8 bushels per acre—then a record and 9.5 bushels above 2024. NASS forecast soybean production at 4.29 billion bushels, 2% below 2024, despite a then-record average yield forecast of 53.6 bushels per acre, 2.9 bushels above 2024. All-wheat production was forecast at 1.93 billion bushels, down 2% from 2024. These were national survey estimates, not realized harvest totals. USDA NASS, August 12, 2025.
For a farm-level comparison, consider whether local growing conditions and planted or harvested acreage differ from the national picture. Then watch how later USDA estimates compare with the August forecast; a forecast and the eventual crop are different measures.
#1 Best Overall

- Direct readout for 40 different grain scales
- Test high moisture grain up to 40%
- Illuminated multilingual display - English, Spanish, French, German, Italian, Portuguese, Swedish
- Includes Protective carrying case with shoulder strap
- Single-point or Precision multi-point calibration to match local elevator
2. What do crop conditions say about remaining yield risk?
Crop-condition ratings offer a timely signal about crop health, while a yield forecast estimates bushels per acre. Neither is a substitute for the other, and a favorable rating does not lock in a final yield.
NASS reported that 73% of the U.S. corn crop was rated good or excellent as of August 3, 2025, six percentage points above the comparable date in 2024. Treat that as a dated snapshot: weather and crop development after the report date could still affect yields. USDA NASS, August 12, 2025.
When reading weekly condition updates, compare the rating date and direction of change with USDA’s published yield estimate. A condition percentage is not itself a yield measurement.
Rank #2

- High Precision & Consistency: Achieve accurate grain moisture readings with an industry-leading accuracy of ±0.5%, even under diverse environmental conditions. Ensure every measurement is reliable, giving you full confidence in the quality of your grains.
- Supports 25 Types of Grains: GS25A is versatile and supports the measurement of 25 different grain types, including wheat, corn, rice, coffee beans, and more. Easily switch between grains to get precise moisture content, tailored to your specific crop.
- User-Friendly & Portable Design: The lightweight, compact design and intuitive LCD display make GS25A easy to carry and operate in the field or storage. The straightforward interface allows anyone to perform accurate measurements with minimal setup.
- Automatic Temperature Compensation: With built-in automatic temperature compensation, GS25A ensures consistent and precise measurements, regardless of changes in ambient temperature, making it ideal for both indoor and outdoor use.
- Long Battery Life & Convenient Power Options: Powered by 4 AAA batteries and an additional CR-2032 battery (Package does not include batteries), GS25A is designed for extended field use. Stay productive without the constant worry of battery replacement.
3. How do supply, use, and corn carryout affect the outlook?
Production alone does not describe whether supplies are tight or abundant. Read it alongside beginning stocks, domestic use, exports, and ending stocks. Ending stocks—often called carryout—are projected inventory remaining at the close of a marketing year. Their significance depends on how much supply is expected to be used.
In its August 2025 Feed Outlook, USDA’s Economic Research Service (ERS) projected 2025/26 corn ending stocks at 2.117 billion bushels, the highest since 2018/19 in that outlook. ERS also lowered its projected season-average farm price by 30 cents to $3.90 per bushel, citing higher stocks relative to use. These were USDA outlook figures, not final carryout or a price offered to a farmer. USDA ERS, Feed Outlook: August 2025.
For a broader cross-commodity view, USDA’s monthly World Agricultural Supply and Demand Estimates (WASDE) forecasts supply and use for U.S. and world wheat, coarse grains, oilseeds, and other commodities. Compare production and stocks with expected domestic use and exports rather than judging a large stock figure in isolation. USDA WASDE release, August 12, 2025.
Rank #3

- 𝟐𝟐 𝐆𝐑𝐀𝐈𝐍𝐒 𝐒𝐔𝐏𝐏𝐎𝐑𝐓 – The grain moisture meter is specifically designed to measure the moisture content of 22 different grains, including wheat, maize, japonica rice, and soybean. This device ensures high accuracy with its advanced multi-point calibration system, which guarantees reliable results.
- 𝐋𝐎𝐖 𝐏𝐎𝐖𝐄𝐑 𝐂𝐎𝐍𝐒𝐔𝐌𝐏𝐓𝐈𝐎𝐍 – Our seed moisture tester is engineered for long-lasting use, operating on a 9V battery that lasts up to one year. It features an automatic shutdown function to conserve battery life, making it an economical choice for continuous use. Whether testing flaxseed, almonds, or cashews, this tester ensures that users can efficiently manage their resources while obtaining precise moisture readings with minimal power consumption.
- 𝐀𝐔𝐓𝐎𝐌𝐀𝐓𝐈𝐂 𝐓𝐄𝐌𝐏𝐄𝐑𝐀𝐓𝐔𝐑𝐄 𝐂𝐎𝐌𝐏𝐄𝐍𝐒𝐀𝐓𝐈𝐎𝐍 – This moisture meter for seeds comes equipped with automatic temperature compensation, ensuring that readings remain accurate regardless of environmental changes. This feature makes it especially useful in varying weather conditions, providing reliable moisture data for seeds like jute seed, raspberry seed, and red bean.
- 𝐋𝐀𝐑𝐆𝐄 𝐑𝐀𝐍𝐆𝐄 𝐄𝐑𝐑𝐎𝐑 𝐂𝐎𝐑𝐑𝐄𝐂𝐓𝐈𝐎𝐍 – The automatic moisture analyzer is built with large range error correction to deliver highly accurate moisture readings across a broad spectrum of grains and seeds. This feature ensures that even extreme moisture content variations are correctly measured, reducing the possibility of errors.
- 𝐋𝐂𝐃 𝐃𝐈𝐒𝐏𝐋𝐀𝐘 – The MT-22 moisture tester is designed with an easy-to-read LCD display, providing a quick and clear view of the moisture content of grains and seeds such as sorghum, millet, and rapeseed. This straightforward interface allows for fast results, making it ideal for users who need to make rapid decisions. Whether for field or lab use, this moisture tester offers simplicity and efficiency, streamlining moisture measurement processes.
4. How should farmers read export demand and movement?
USDA’s export forecast describes expected exports over a marketing year; export inspections are a measure of grain inspected or shipped for export. They are related, but they are not the same thing as export sales commitments.
ERS raised its August 2025 forecast for 2025/26 corn exports by 200 million bushels to 2.875 billion bushels. Its outlook discussed larger exportable supplies, expected lower world prices, and demand from traditional markets including Mexico and Colombia as factors. This was a USDA forecast, not a report of completed shipments. USDA ERS, Feed Outlook: August 2025.
Recommended Free Tools
For current movement, USDA’s Agricultural Marketing Service (AMS) National Grain Reports page links recurring market reports, including weekly grain export inspection reporting. Compare those shipment indicators with USDA’s supply-and-use export outlook, keeping the marketing year and the measure in view. The cited AMS index establishes where recurring reports are available, but no specific August 2025 weekly inspection figure is stated here. USDA AMS, National Grain Reports.
Rank #4
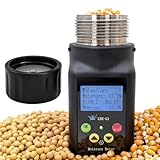
- AGRICULTURAL GRAIN CHECKS: This portable corn moisture tester and grain moisture meter supports on-farm reference checks for farmers, grain handlers, and grain or feed processors
- 25 CROP PROFILES: Select the matching profile for corn, wheat, soybeans, paddy rice, barley, oats, sorghum, and other supported crops before each measurement
- CONSISTENT SAMPLE PREPARATION: Use a representative sample, fill the clean and dry chamber evenly, and tighten the cap securely without overtightening for more consistent readings
- AUTOMATIC TEMPERATURE COMPENSATION: Built-in ATC adjusts the displayed result for sample temperature; for better consistency, let the meter and sample reach similar temperatures before testing
- USER-ADJUSTABLE CORRECTION: When a trusted reference method shows a consistent difference, use the correction setting to adjust the displayed value; the setting remains saved after power-off
5. How do futures prices compare with local cash bids and basis?
A national season-average farm price forecast is a projection for the marketing year, not a bid from a local elevator. A farmer’s cash price depends on the local bid and its relationship to the relevant futures contract, including basis, delivery location, and delivery timing.
In the August 2025 ERS outlook, USDA’s projected 2025/26 corn season-average farm price was $3.90 per bushel after a 30-cent reduction. ERS also described Louisiana Gulf and Central Illinois cash bids as trending lower in recent weeks and Illinois conventional country elevator bids for U.S. Yellow #2 corn as in the mid- to upper-$3-per-bushel range. Those were dated regional observations, not universal or current prices. USDA ERS, Feed Outlook: August 2025.
To make the comparison useful for a marketing decision, line up the same crop and delivery period: the relevant futures contract, your elevator’s cash bid, and the implied basis. ERS documentation explains that its official WASDE season-average price forecast is distinct from ERS model forecasts and describes cash price context as something to interpret alongside futures. The documented forecasts use futures-price and producer-price inputs; they should not be mistaken for an individual farm’s offer. USDA ERS, Season-Average Price Forecasts: Documentation.
The Tool Desk
Outbyte PC Repair FREEClear out junk files and repair common Windows errorsFree Scan →Outbyte Driver Updater FREEScan for outdated or missing drivers - takes under a minuteDriver Scan →Best Value

- Professional Grain Moisture Meter: Quickly measure moisture (%), weight (g), density (g/L), and temperature (℃) of 20+ grains. Featuring a 3~35% moisture range, ±0.5% accuracy, and ≤0.2% repeatability, results are precise in just 10 seconds;
- Easy Calibration for Accurate Weighing: Use the 200g weight to quickly verify before each weighing. The simple calibration process guarantees precise, dependable results every time;
- Enhanced Temperature Compensation: This grain tester utilizes advanced variable frequency capacitive technology with automatic thermistor compensation for precise measurements during grain procurement and storage;
- Dual Power Options: Our Grain Moisture Meter can be powered by either 4 AA batteries or via USB plug, providing flexibility for short or long-term use whether you are on the go or need extended measurement sessions;
- Package Contents: 1 Grain Moisture Meter, 1 Portable Aluminum Case, 1 x 200g Calibration Weight, 4 AA Batteries, 1 Power Adapter, 1 Small Brush, 1 Chute Bucket, 1 Sampler;
A practical August monitoring routine
- Record the forecast vintage. Note the publication date and marketing year for each USDA estimate so forecasts are not confused with realized results or later revisions.
- Update the crop picture. Compare NASS production and yield estimates with dated crop-condition reports and your farm’s own acreage and field outlook.
- Read stocks against use. Use WASDE and ERS supply-and-use projections to see how production, domestic use, exports, and carryout fit together.
- Separate export expectations from movement. Compare the marketing-year export forecast with weekly AMS inspections, and do not treat inspections as sales commitments.
- Check the price you can actually act on. Compare the relevant futures contract with local cash bids, basis, and delivery terms rather than treating a national season-average forecast as a farm price.
ERS says its season-average price forecasts are made weekly using the most recently available data as of each Thursday and updated on the ERS webpage once a month. The published update schedule is useful context when checking a forecast’s date. USDA ERS, Season-Average Price Forecasts: Documentation.
What the August 2025 figures do—and do not—establish for soybeans and wheat
The August NASS release provides the soybean production and yield forecasts above, but those figures alone do not establish soybean demand or export sales. Do not infer either from production.
The August 2025 ERS Wheat Outlook explains changes to U.S. and world wheat supply-and-use projections from the August WASDE. The specific wheat export, ending-stock, and price changes are not stated here, so use the report or WASDE tables for those figures rather than extrapolating from the 1.93-billion-bushel production forecast. USDA ERS, Wheat Outlook: August 2025.
Quick Recap
Product prices and availability are accurate as of the date/time indicated and are subject to change. Any price and availability information displayed on Amazon at the time of purchase will apply.
Quick wins for a faster PC:
Fix the driver behind crashes, sound loss and screen glitchesFind Drivers →Clear out junk files and repair common Windows errorsFree Scan →



