The Tool Desk
Outbyte PC Repair FREERepair Windows errors before they cause bigger problemsFix Now →Outbyte Driver Updater FREEScan for outdated or missing drivers - takes under a minuteDriver Scan →The fastest dependable way to build a sales tracker in Excel is to use one structured table with one row per opportunity, controlled drop-down fields, calculated pipeline values, and a dashboard built from that table. The template structure below is designed for solo sellers and small teams tracking prospects, deal stages, follow-ups, and closed sales without implementing a CRM.
You can build it in desktop Excel or in Excel for the web, which Microsoft offers free with a Microsoft account for core spreadsheet work. Advanced desktop features and Copilot may require a Microsoft 365 subscription.

What this Excel sales tracker measures
A sales tracker records prospects and opportunities, then turns them into a view of pipeline and sales performance. It should distinguish an open estimate from money actually won.
- Pipeline: Open opportunities that may close.
- Weighted pipeline: Open deal value multiplied by an assigned probability.
- Won sales: Opportunities marked Closed Won.
- Revenue: A defined accounting measure such as invoiced or recognized revenue; it is not automatically the same as deal value.
This guide builds an opportunity and pipeline tracker. You can add an optional Transactions sheet when you need invoice, order, payment, or line-item reporting.
Quick wins for a faster PC:
Repair Windows errors before they cause bigger problemsFix Now →Scan for outdated or missing drivers - takes under a minuteDriver Scan →#1 Best Overall
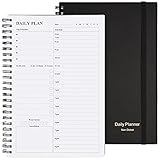
- Start Plan Anytime: The daily planner is undated,if you miss a day or you are off of work that day you don’t need to waste a page, start use this schedule planner any time.
- Work Smarter with Daily Task Management: Each page includes space for 5 top priorities, 8 to do list,daily schedule from 6am-9pm, notes&ideas and water intake.Break your day into hours and help you work effective.
- Portable Size: 8.3 x 5.8 inch, perfect size to fit in your bag.1 quick reference sheet and 79sheet (158 page),100gsm non-bleed paper, thick paper with clear printing, suitable for most pen.
- Funtional Details:Sturdy PVC cover help protect the planner,elastic band keep the notebook close nicely or you can use the elastic closure to mark your page, two pocket in the back stroage your note receipts and cards,twin-wire binding allows turning pages smoothly and laying flat.
- Get Closer to Your Goals: The hourly planner allows you to keep track of every appointment, with space for your top goals and task, this agenda notebook will help you do more,achieve more and save time. This will be a perfect gift for busy person.
Workbook layout
| Sheet | Purpose |
|---|---|
| Start Here | Instructions, field definitions, stage rules, and maintenance notes. |
| SalesData | The single input table, named tblSales, with one row per opportunity. |
| Lists | Approved values for stages, statuses, owners, lead sources, products, regions, and lost reasons. |
| Dashboard | KPI cards, PivotTables, charts, slicers, and a reporting-period selector. |
| Transactions (optional) | Invoices, orders, or product-line sales when opportunity-level totals are not enough. |
Columns to include in SalesData
Enter these headers in row 1. Do not make every field mandatory; excessive required fields encourage inaccurate placeholder entries.
| Column | Use |
|---|---|
| Opportunity ID | Unique record identifier. |
| Opportunity Name | Readable deal name. |
| Account | Company or customer. |
| Contact | Primary buyer or contact. |
| Owner | Responsible salesperson. |
| Lead Source | Referral, website, event, outbound, or another source. |
| Product/Service | What is being sold. |
| Quantity | Units, seats, or items. |
| Unit Price | Price per unit. |
| Discount | Percentage or fixed amount, using one convention consistently. |
| Deal Value | Calculated gross or net opportunity value. |
| Stage | Observable buyer progress. |
| Probability | Chance estimate, entered consistently as a percentage or decimal. |
| Weighted Pipeline | Deal Value multiplied by Probability. |
| Created Date | Date the opportunity entered the pipeline. |
| Expected Close Date | Forecast close date. |
| Actual Close Date | Date won or lost. |
| Status | Open, Closed Won, Closed Lost, or On Hold. |
| Next Action | Specific next step. |
| Next Follow-Up Date | Date the next contact is due. |
| Follow-Up Status | Calculated overdue, due-today, or upcoming label. |
| Days Open | Calculated age of an active or closed opportunity. |
| Lost Reason | Required explanation for closed-lost deals. |
| Notes | Objections, context, and important details. |
Optional fields include region, territory, industry, campaign, renewal date, contract term, monthly or annual recurring revenue, margin, competitor, last-contact date, activity count, customer segment, payment status, and invoice number.
Build the structured table
- Enter the headers and sample records on SalesData.
- Select the range and choose Insert > Table. Confirm My table has headers.
- On Table Design > Table Name, enter
tblSales. - Format monetary fields as currency, probabilities as percentages, and dates as a consistent format such as
mmm d, yyyy.
Excel Tables automatically extend formatting, filters, structured formulas, and references as records are added. Microsoft documents Tables and related analysis features in its Excel data-analysis guidance.
Add controlled drop-down menus
On Lists, create values such as these:
- Stages: Prospecting, Qualified, Discovery, Solution Fit, Proposal, Negotiation, Closed Won, Closed Lost.
- Statuses: Open, Closed Won, Closed Lost, On Hold.
- Lead sources: Referral, Website, Event, Outbound, Partner, Other.
- Lost reasons: Price, Timing, Competitor, No Decision, Poor Fit, Other.
- Select the relevant table column.
- Choose Data > Data Validation.
- Set Allow to List.
- Use a range such as
=Lists!$A$2:$A$8, or create named ranges such asStageListand use=StageList.
Drop-downs prevent variants such as Proposal, proposal, and Proposal from splitting summaries. If a list is missing, check that the source range exists, the sheet name is spelled correctly, and the validation source includes the new item.
Outdated Drivers Are Slowing You Down
One free scan finds every outdated or missing driver and matches the right update for your exact hardware.Free scan · exact hardware matchPC Slower Than It Used to Be?
A free scan shows the junk files, broken settings and background clutter dragging Windows down - then fixes them in one click.Free scan · Windows 10 & 11Use formulas for automatic calculations
Deal value
For quantity, unit price, and a percentage discount:
=[@Quantity]*[@[Unit Price]]*(1-[@Discount])
For a fixed discount:
=[@Quantity]*[@[Unit Price]]-[@Discount]
Label the result precisely: gross sales, net sales after discount, contract value, annual recurring revenue, or another defined measure. Do not call every estimate revenue.
Weighted pipeline
If Probability is entered as 25%:
=[@[Deal Value]]*[@Probability]
If users enter 25 for 25 percent, use:
=[@[Deal Value]]*([@Probability]/100)
Never mix the two input conventions.
Days open
=IF([@Status]="Open",TODAY()-[@[Created Date]],[@[Actual Close Date]]-[@[Created Date]])
If On Hold records are also active:
=IF(OR([@Status]="Open",[@Status]="On Hold"),TODAY()-[@[Created Date]],[@[Actual Close Date]]-[@[Created Date]])
Free tools Windows power users keep installed
One-click scans. No signup required.
Rank #2

- Easily Stay On Track & Make The Most of Your Time: ZICOTOs’ daily planner makes it easier than ever for you to stay organized, reduce stress & enjoy more free time! Arrange your schedule, priorities, to do’s and jot down plans & ideas on the daily notes section
- Smartly Plan Ahead & Boost Your Productivity: Absolutely clever & efficient! With the planner notebook you can break down your daily tasks into half-hourly focus blocks and map out priorities & follow-up duties to keep your day on track and enhance productivity
- Plenty Of Space For Efficient Planning: Stay focused & manage your time wisely! The 9.3x6.3” (inner pages) work planner & organizer notebook offers ample space for 80 days of life-changing planning with each day being spread across 2 pages - set yourself up for purposeful days
- Now Is The Best Time To Start: The daily planner is undated so you can start to add structure to your schedule and cultivate new planning habits right away! Beat procrastination, boost happiness & make each day count with the hourly planner
- Adds Beauty To Daily Planning: A gorgeous champagne pink cover, chic gold foil letters, a golden ring wire and a clean, easy-to-use layout - enjoy the gorgeous and modern minimalist design of the undated daily planner!
TODAY() changes when the workbook recalculates, so this is an operational age, not a permanent historical snapshot.
Follow-up status
=IF(OR([@[Next Follow-Up Date]]="",[@Status]="Closed Won",[@Status]="Closed Lost"),"",IF([@[Next Follow-Up Date]]<TODAY(),"Overdue",IF([@[Next Follow-Up Date]]=TODAY(),"Due Today","Upcoming")))
Month bucket
For a real first-of-month date:
=DATE(YEAR([@[Expected Close Date]]),MONTH([@[Expected Close Date]]),1)
For month end:
=EOMONTH([@[Expected Close Date]],0)
Use dates rather than text such as “January 2026” so sorting, filtering, and timelines work correctly.
Highlight risk with conditional formatting
Use Home > Conditional Formatting for:
- Red fill for overdue follow-ups.
- Amber fill for follow-ups due today or close dates within 30 days.
- Green fill for Closed Won and gray or red fill for Closed Lost.
- Data bars for high-value opportunities.
- A warning when an open opportunity has no next action.
For example, an overdue-open rule can use:
=AND($R2<TODAY(),$M2<>"Closed Won",$M2<>"Closed Lost",$R2<>"")
Change the column letters to match your workbook. Microsoft describes rules for ranges, Tables, and (on Windows) PivotTable reports in its conditional-formatting documentation.
Build dashboard KPIs
Place these formulas on Dashboard. They assume the table is named tblSales.
| KPI | Formula | Definition |
|---|---|---|
| Total open pipeline | =SUMIFS(tblSales[Deal Value],tblSales[Status],"Open") |
Value of records marked Open. |
| Weighted open pipeline | =SUMIFS(tblSales[Weighted Pipeline],tblSales[Status],"Open") |
Open value multiplied by assigned probabilities. |
| Won revenue or bookings | =SUMIFS(tblSales[Deal Value],tblSales[Status],"Closed Won") |
Use the label that matches what Deal Value represents. |
| Open opportunity count | =COUNTIFS(tblSales[Status],"Open") |
Number of open records. |
| Closed-deal win rate | =IFERROR(COUNTIFS(tblSales[Status],"Closed Won")/(COUNTIFS(tblSales[Status],"Closed Won")+COUNTIFS(tblSales[Status],"Closed Lost")),0) |
Won divided by won plus lost; not a forecast probability. |
| Average won deal size | =IFERROR(AVERAGEIFS(tblSales[Deal Value],tblSales[Status],"Closed Won"),0) |
Average value of won records. |
For monthly close reporting, put the period start in B2 and end in B3:
=COUNTIFS(tblSales[Expected Close Date],">="&$B$2,tblSales[Expected Close Date],"<="&$B$3,tblSales[Status],"<>Closed Won",tblSales[Status],"<>Closed Lost")
What’s actually slowing this PC down?
Pick the symptom - the matching free tool is one click away.
Rank #3

- Half Meeting Half Note: 1.MEETING PLANNING: Date, Location, Topic & Attendees 2.MEETING MINUTES: Agenda, Quick Notes & Other 3.NOTES AREA: Lined Page 4.ACTION ITEMS: Action Steps, Person, Due Date & Check Box 5.NEXT MEETING: Date, Time & Location 6.INDEX PAGE: Date, Title, Page Number, which will help create more effective meetings and good results.
- Premium Quality Notebook for Work: Golden spiral binding is sturdy and flexible, with easy-to-turn pages. Hot-stamped cover is water-resistant and not easy to bend. Bonus Bookmark and Pockets. Perfectly hold up well to frequent transfers in and out of backpacks, briefcases, and cars.
- Fight Ink-bleeding & Great Size: The high-end 100gsm paper could prevent ink bleeding through or feathering, handle double-sided writing and most daily use pens pretty well. The office/business work notebook measures 7.5"x 10"(similar to B5 size), Generous size provides ample space to jot down your meeting notes.
- Each 160 Pages Per Book: Provide ample space for note taking & planning and with the date section at the top for tracking them. With 160 pages for meeting minutes, the manager notebook will cover more than half a year, even in daily use. Also provides index pages for organizing this office planner.
- Better Tool Drives Better Meetings: The hassle of organizing the chaotic meeting notes VS this professional meeting notebook. Definitely a step up! Everything is neatly zoned on each page makes it a breeze to fill them out and ensure all you need are accounted for.
For quota attainment, put the quota in B5 and use closed-won dates:
=IFERROR(SUMIFS(tblSales[Deal Value],tblSales[Status],"Closed Won",tblSales[Actual Close Date],">="&$B$2,tblSales[Actual Close Date],"<="&$B$3)/$B$5,0)
Define whether quota means closed sales, bookings, invoiced revenue, collected cash, or new recurring revenue; these measures are not interchangeable.
Add PivotTables, charts, slicers, and a timeline
- Select any cell in
tblSalesand choose Insert > PivotTable > New Worksheet. - Create a pipeline view with Stage in Rows and Sum of Deal Value plus Count of Opportunity ID in Values.
- Create a representative view with Owner in Rows and Sum of Deal Value in Values, filtered by Status.
- Create a monthly won-sales view with Actual Close Date in Rows, Sum of Deal Value in Values, and Status filtered to Closed Won.
- Create a lead-source view with Lead Source in Rows and counts of opportunities and Closed Won records in Values.
- Add charts: columns for sales by owner, bars for pipeline by stage, and a line chart for won sales by month.
- Use PivotTable Analyze > Insert Slicer for Owner, Stage, Region, Lead Source, or Product.
- Use PivotTable Analyze > Insert Timeline for date filtering.
Microsoft documents PivotTables, PivotCharts, slicers, and timelines in its business-intelligence guidance.
Do these 3 things before closing this tab:
1Fix the driver behind crashes, sound loss and screen glitches2Clear out junk files and repair common Windows errors3Scan for outdated or missing drivers - takes under a minuteRefresh and maintain the dashboard
- Add records inside
tblSales, not below a fixed source range. - Choose Data > Refresh All, or right-click a PivotTable and select Refresh.
- If new rows are absent, open PivotTable Analyze > Change Data Source and set the source to
tblSales. - Review formulas, filters, and charts before sharing the dashboard.
PivotTables may not refresh merely because a row was added. A Table source and an explicit refresh prevent many reporting surprises.
Independent reader supportYour contribution helps us test, update, and keep practical guides available for everyone.A practical weekly operating routine
- Record or update an opportunity immediately after a sales interaction.
- Review overdue follow-ups each day.
- Check stage, probability, next action, and expected close date every week.
- Remove duplicates and require a lost reason for Closed Lost records.
- Refresh the dashboard before a sales meeting.
- Keep a dated backup before archiving old periods.
Common errors and fixes
Dates are not calculating
Dates may be text, use mixed regional formats such as 03/04/2026, contain timestamps, or include blanks in comparisons. Re-enter them as actual Excel dates and apply one display format.
The dashboard excludes new records
Check that the record is inside tblSales, then refresh. Fixed-range PivotTable sources do not automatically include rows outside the range.
Totals are too high with line items
When one opportunity has multiple product rows, store an Opportunity ID and do not repeat the full deal total on every line. Summarize line items through a PivotTable or formulas.
Weighted pipeline looks unrealistic
Arbitrary probabilities, stale deals, duplicated opportunities, inconsistent stages, repeatedly pushed close dates, and inflated rep estimates all distort it. Review stale records weekly and calibrate probabilities against historical conversion rates.
Formulas stop filling down
Confirm the range is still an Excel Table and that formula columns were not overwritten. Protect formula columns when several people edit the file.
When Excel is enough—and when it is not
Excel is a reasonable starting point when one person or a small team maintains a modest pipeline, the process is still changing, and manual updates provide enough visibility. It becomes a poor fit when the workflow depends on frequent simultaneous edits, automatic reminders, email or calendar synchronization, mobile activity entry, role-based permissions, audit history, duplicate prevention, or tightly controlled forecasting.
HubSpot positions its spreadsheet CRM template toward people managing roughly their first 25–50 customers or leads and presents a dedicated CRM as the next step when manual maintenance becomes burdensome. That is vendor guidance for its template, not a universal Excel limit. See HubSpot’s CRM spreadsheet template for an alternative with separate organizations, contacts, opportunities, interactions, dropdowns, and dashboard views.
A practical migration path is to keep stable IDs and consistent fields now, then map Account, Contact, Opportunity, Owner, Stage, Status, dates, value, and activity history into a CRM later.
Sharing, privacy, and version choices
- For collaboration, store the workbook in OneDrive or SharePoint rather than emailing copies.
- Protect the Lists, Dashboard, and formula columns where appropriate.
- Assign one person responsibility for data quality and keep a dated backup.
- Do not store payment-card details, passwords, or unnecessary sensitive personal information.
- Excel for the web supports core tables, formulas, sharing, and collaboration, but desktop-only capabilities such as some VBA, Power Query authoring, external connections, and data-model workflows vary by edition and platform.
The formulas in this guide use broadly supported functions such as SUMIFS, COUNTIFS, IFERROR, TODAY, DATE, YEAR, MONTH, EOMONTH, and AVERAGEIFS. Newer functions such as FILTER, UNIQUE, SORT, and XLOOKUP require a compatible modern Excel version.
Free template starting point
To make the template reusable, save a clean master workbook after setting up Start Here, SalesData, Lists, and Dashboard. Save it as .xltx when you want each new file to start from the blank model, or as .xlsx when you want a normal workbook copy. Replace sample records only after checking that formulas, validation lists, PivotTables, and charts work together.
For a ready-made Microsoft starting point, see Microsoft’s Excel templates. A purpose-built tracker with the fields and formulas above is better suited to pipeline follow-up than a generic formatted grid.
Recommended Free Tools
The Bottom Line
Build the tracker around one Excel Table, standardize every category with drop-downs, calculate value and follow-up status in the table, and refresh a dashboard from that source. That gives a small sales operation useful pipeline visibility while preserving a clear path to a CRM when automation, integrations, permissions, or auditability become essential.
Quick Recap
Product prices and availability are accurate as of the date/time indicated and are subject to change. Any price and availability information displayed on Amazon at the time of purchase will apply.




