Free tools Windows power users keep installed
One-click scans. No signup required.
NetApp’s all-flash-array revenue reached $1.0 billion in Q3 FY2026, even as management described memory-price inflation as unprecedented and said the company had raised prices. The quarter ended January 23, 2026; NetApp later reported a still larger all-flash record of $1.2 billion in Q4. The figures show strong demand for flash systems, but they do not reveal how much growth came from higher prices, more units, or product mix.
What NetApp reported in Q3—and what “record” meant
The record was for all-flash-array revenue, not total company revenue. NetApp reported $1.713 billion in total Q3 FY2026 revenue, up 4% year over year, while all-flash-array revenue was $1.0 billion, up 11%. The company also cited a $4.2 billion annualized all-flash run rate. That run rate multiplies one quarter’s products-and-services revenue by four; it is not annual recognized revenue, a forecast, or a measure of backlog. NetApp’s February 26, 2026 results release gives the quarter’s financial details.
| # | Preview | Product | Price | |
|---|---|---|---|---|
| 1 |
|
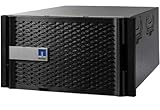
AFF8080EX NetApp ($4,500) All Flash FAS (AFF) Filer - Single Chassis, Dual Controllers, Dual Power... | $4,500.00 | Buy on Amazon |
| Measure | Q3 FY2026 | Year-over-year change |
|---|---|---|
| Total revenue | $1.713 billion | +4% |
| Hybrid Cloud revenue | $1.539 billion | +5% |
| Public Cloud revenue | $174 million | Flat |
| All-flash-array revenue | $1.0 billion | +11% |
| Billings | $1.886 billion | +10% |
| GAAP net income | $334 million | +12% |
| Non-GAAP net income | $423 million | +7% |
All-flash growth substantially outpaced the company’s 4% revenue growth, indicating that flash systems were an important part of the quarter’s performance. The disclosed results do not provide a full bridge separating unit volume from price, product mix, software, or services. NetApp reported GAAP earnings of $1.67 per share and non-GAAP earnings of $2.12 per share; those adjusted and unadjusted measures should not be treated as interchangeable.
What rising memory and SSD costs changed
In remarks reported by CRN after the Q3 earnings call, CEO George Kurian characterized memory-price inflation as unprecedented. In this storage-system context, “memory” refers broadly to components including flash media and related memory-intensive parts; the comments do not quantify a single industry-wide price index or establish that every component rose at the same rate.
Crashes, No Sound, or Screen Glitches?
Random freezes, missing sound and display glitches usually trace back to one bad driver. Find and replace yours safely.Free scan · under a minuteWindows Errors? Fix Them Before They Spread
Repair common Windows errors and clear accumulated junk for a smoother, more stable PC - no reinstall needed.Free scan · no reinstall#1 Best Overall
- Includes Flash Bundle License Keys: FCP, ISCSI, NFS, CIFS, SNAPRESTORE, SNAPMIRROR, SMBR-C, FLEXCLONE, SNAPMANAGER, SNAPVAULT, VE. Professionally Tested and Reset to Factory Specifications!
- All NetApp Systems have been Certified by our in-house Technicians. Professionally packed for safe and secure shipping to your facility. Full Warranty!
- Please contact us for optional storage (drives) configurations or if you require a different base system than what we offer here. We can probably accommodate your needs.
- Pricing: Kurian said NetApp had raised prices at the beginning of Q3 and could raise them again if needed. The company did not disclose the exact pass-through rate or isolate the resulting effect on margins.
- Suppliers and components: NetApp said it was working with multiple suppliers and qualifying alternative components.
- Inventory: CFO Wissam Jabre said the company bought some components on the open market to replenish inventory after demand for selected products exceeded expectations. Management said earlier pre-buys substantially covered FY2026 needs, while Q4 could require additional replenishment.
- Customer choices: Management described working with customers and channel partners on purchasing and architecture decisions as costs changed.
Price inflation was not the same as a reported shortage
During the Q3 call, Kurian said NetApp was not experiencing supply shortages and was not aware of upcoming shortages at that time. Jabre nevertheless described a less predictable component mix and the need to replenish some inventory through the open market. Those statements can coexist: higher prices, allocation risk, or uncertain lead times do not by themselves mean a vendor is unable to ship. The reported comments support concern about cost and planning uncertainty, not a claim that NetApp had stopped fulfilling orders.
Why all-flash sales stayed strong—and why hybrid arrays entered the discussion
Management said price increases prompted more customer discussions about architecture, including greater interest in hybrid-flash arrays. Kurian said it was too early to call that a trend and noted that price increases had been greater for all-flash than hybrid-flash systems. This is evidence of buyers reconsidering trade-offs, not proof of a broad or lasting shift away from flash.
All-flash systems can suit latency-sensitive databases, virtualization, analytics, and demanding data pipelines. They can also offer more predictable performance and, depending on the workload and system, favorable power, cooling, or rack-density economics. Their trade-offs include higher exposure to SSD costs and the risk of paying for performance a workload does not use.
Hybrid-flash arrays keep flash available for frequently accessed data while using hard drives for colder or less latency-sensitive capacity. That can improve capacity economics during flash-price pressure, but performance may be less uniform when data sits on disk; the architecture can also bring additional operational and physical-capacity considerations. NetApp’s ability to offer both approaches gives customers a portfolio choice, but the best fit depends on measured workload needs rather than the quarter’s market narrative.
Recommended Free Tools
AI was a growth factor, not a proven explanation for the entire record
NetApp management said AI was becoming a more important growth driver. CRN reported management’s figure of about 300 customers selecting NetApp in Q3 to prepare data for AI workloads or use NetApp as the storage foundation for AI innovation, compared with roughly 100 in the same period a year earlier. These are company-reported customer wins; the account does not define their size or establish that each represented a comparable revenue contribution.
Management also said about 60% of NetApp’s AI business mix involved data preparation, data readiness, or data-lake use cases, while about 40% involved production training or inferencing. AI storage needs can include data preparation, metadata and file services, movement between environments, governance, resilience, and production pipelines—not only high-speed storage attached directly to GPUs. The company’s reported figures make AI a plausible contributor to demand, but they do not quantify how much of the all-flash revenue increase AI generated.
AFX and AI Data Engine
NetApp positioned AFX as a disaggregated storage system for AI, separating storage, services, and control to support performance and scale. Its AI Data Engine is software intended to help with data discovery, curation, policy guardrails, and real-time vectorization for generative-AI workflows. AFX had begun shipping after the Q3 report, while management expected AI Data Engine to become generally available in Q4 FY2026. The Q3 release and call describe these as elements of a broader platform strategy, not as a quantified explanation for the flash-revenue record.
Independent reader supportYour contribution helps us test, update, and keep practical guides available for everyone.Q4 made the Q3 headline less current—but strengthened the trend
As of August 18, 2026, Q3 is not NetApp’s latest reported quarter. In results released May 28, 2026, the company said Q4 all-flash-array revenue reached $1.2 billion, up 18% year over year. Q4 total revenue was $1.95 billion, up 12%; full-year FY2026 revenue was $6.93 billion, up 5%, and billings were $7.21 billion, up 6%. NetApp’s Q4 and FY2026 results therefore show that Q3 was followed by another, larger all-flash record.
The follow-through argues against treating Q3 as an isolated flash-revenue spike. It does not show whether the later increase was primarily unit demand, price realization, product mix, or some combination, nor does it establish that component inflation left margins untouched. The published figures do not provide that full decomposition.
What enterprise storage buyers should check before committing
A record for a vendor is not a buying recommendation. Buyers comparing NetApp or another enterprise storage supplier should evaluate the system against their own capacity, performance, resilience, and contract requirements.
- Benchmark the workload: Measure latency, IOPS, throughput, concurrency, and bursts under realistic conditions. Do not buy an AI-branded system without documenting the relevant data path and performance requirement.
- Model usable capacity: Account for data reduction assumptions, snapshots, replication, and reserved headroom. Ask which assumptions are guaranteed and which are estimates.
- Separate hot and cold data: Compare all-flash, hybrid-flash, and cloud placement based on access patterns and service levels, not just headline price per raw terabyte.
- Confirm supply and quote terms: Request the quote-validity period, SSD and controller availability, delivery expectations, and expansion pricing in writing.
- Price the full lifecycle: Include support, maintenance and renewal increases, replication or cloud charges, expansion costs, and migration or operating requirements.
- Scrutinize consumption contracts: For a consumption offer such as NetApp Keystone, examine minimum commitments, included support and upgrades, excess-capacity charges, renewal terms, and termination provisions. A consumption model is not automatically cheaper; fit depends on utilization and contract terms.
- Test resilience and portability: Check ransomware recovery, immutable snapshots, replication, failover, recovery-time objectives, data portability, APIs, and cloud interoperability.
Enterprise arrays including NetApp AFF and AFX, Pure Storage FlashArray, Dell PowerStore, HPE Alletra Storage MP, and IBM FlashSystem generally require a vendor or channel quote rather than displaying standardized public purchase prices. Buyers should compare proposals on equivalent usable capacity, workload performance, support, and contract duration instead of assuming a public “starting price.”
What the results mean for the storage market
NetApp’s Q3 and Q4 results show that all-flash systems continued to sell strongly through a period when management said component costs were rising and prices had increased. AI-related demand was part of the company’s explanation, while customer interest in hybrid systems highlighted the cost discipline buyers may apply when flash becomes more expensive. For investors and infrastructure leaders, the key unresolved issue is not whether flash revenue grew—it did—but how much growth reflects durable demand versus price and mix, and how effectively vendors absorb or pass through component costs.
Quick Recap
Product prices and availability are accurate as of the date/time indicated and are subject to change. Any price and availability information displayed on Amazon at the time of purchase will apply.




