Quick wins for a faster PC:
Clear out junk files and repair common Windows errorsFree Scan →Fix the driver behind crashes, sound loss and screen glitchesFind Drivers →Repair Windows errors before they cause bigger problemsFix Now →China produces more farmed aquatic animals than any other country. The latest figures in the FAO data release updated in March 2026 cover 2024: FAO reports China produced 57.6 million tonnes that year. That figure includes farmed aquatic animals, not finfish alone.
What does “farmed fish” mean in this ranking?
In everyday language, “farmed fish” can mean finfish such as carp or salmon. But international aquaculture statistics often use a broader category that includes other aquatic organisms. The FAO’s global series covers production by country or area, species and culture environment, and draws on annual national reports as well as estimates for countries that do not report data. FAO describes it as the only global source for aquaculture production statistics. FAO’s data-collection overview explains the scope.


For a country-to-country comparison, the relevant figure is therefore China’s 57.6 million tonnes of farmed aquatic animals in 2024, as reported by the FAO’s Asia and the Pacific regional office. It should not be presented as 57.6 million tonnes of finfish. The reviewed official source does not establish a comparable 2024 finfish-only ranking for every country. FAO’s regional summary reports the country comparison.
Why do some sources give China a different total?
China’s 2024 national statistics report 60.6003 million tonnes of total aquaculture output, a broader national total than the FAO figure for farmed aquatic animals. The Ministry of Agriculture and Rural Affairs breaks that output into several categories:
Recommended Free Tools
| Category | China’s 2024 output |
|---|---|
| Total aquaculture production | 60.6003 million tonnes |
| Farmed fish | 30.5874 million tonnes |
| Farmed crustaceans | 7.8479 million tonnes |
| Farmed shellfish | 17.6026 million tonnes |
| Farmed algae | 3.0421 million tonnes |
These are China Ministry of Agriculture and Rural Affairs figures published in 2025 for production in 2024. The ministry says aquaculture made up 82.4% of China’s total aquatic-product output, with capture production accounting for the rest. The category figures show why “farmed fish” and “total aquaculture” are not interchangeable. China’s 2024 National Fisheries Economic Statistics Bulletin provides the national breakdown.
How current is the country ranking?
The FAO database update released in March 2026 covers global aquaculture production from 1950 through 2024, making 2024 the latest production year in that data vintage. FAO statistics can be revised, so a precise comparison should identify its production year and the release used. FAO’s March 2026 update notice describes the coverage.
Rank #2
Earlier figures offer context, but they are not substitutes for the current comparison. FAO’s 2022 report said China had produced more farmed aquatic animals and algae than the rest of the world since 1991, and that China represented 56.7% of global farmed aquatic-animal production in 2020. That share refers to 2020, not 2024. FAO’s SOFIA 2022 aquaculture section gives the historical figures.
Likewise, FAO’s 2024 summary reported 130.9 million tonnes of global aquaculture production in 2022. Its country shares for China, India, Indonesia, Viet Nam and Peru describe aquatic-animal production overall, not aquaculture alone, so they do not establish a farmed-only country ranking. FAO’s SOFIA 2024 summary explains that broader global production context.
The Tool Desk
Outbyte PC Repair FREEClear out junk files and repair common Windows errorsFree Scan →Outbyte Driver Updater FREEScan for outdated or missing drivers - takes under a minuteDriver Scan →Rank #3
How to compare farmed-fish figures fairly
When comparing countries, check that each figure uses the same production year and category. In particular, establish whether the total covers finfish only or all farmed aquatic animals, and whether algae are included. FAO’s global series is the appropriate starting point for a like-for-like country ranking; national statistical bulletins can add detail about a country’s categories.
Quick Recap
Best Value
Rank #4
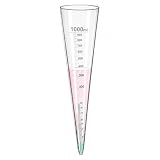
- 🐟 Ideal for Biofloc & Aquaculture Use – Perfect for fish farming and aquaculture systems to monitor water quality and floc performance.
- 💧 Clear, Durable Construction – Made from high-quality transparent material for clear visibility, accurate readings, and long-lasting use.
- 🔬 Educational & Research Applications – Used in labs, colleges, and universities for water sedimentation analysis, microbiology, and biofloc studies.
- 📏 Graduated Markings for Precision – Includes clear volume graduations up to 1000 ml for precise measurement of settled solids and sediments.
- 🧪 1000 ml Imhoff Cone for Sedimentation – Designed for accurate measurement of sludge volume and settling solids in water and wastewater samples.
Product prices and availability are accurate as of the date/time indicated and are subject to change. Any price and availability information displayed on Amazon at the time of purchase will apply.




