Crashes, No Sound, or Screen Glitches?
Random freezes, missing sound and display glitches usually trace back to one bad driver. Find and replace yours safely.Free scan · under a minuteWindows Errors? Fix Them Before They Spread
Repair common Windows errors and clear accumulated junk for a smoother, more stable PC - no reinstall needed.Free scan · no reinstallToday’s U.S. farm economy has some features reminiscent of the 1970s—especially high farmland values and rising debt—but the available figures do not show a repeat of the 1980s farm crisis. USDA’s 2026 forecast puts farm-sector debt at 13.54% of assets, up slightly from 2025. In the 1980s, falling land and commodity prices collided with heavy borrowing and high interest costs. That distinction matters: debt growth deserves attention, but it does not by itself establish that a crisis is imminent.
What makes the comparison useful?
“Is today’s farm economy more like the 1970s or the 1980s?” is best answered by looking at the sequence of events and at several measures together, rather than matching one number from one decade to another.
- Leverage: How much debt is there relative to the value of assets?
- Debt service: Can farm earnings cover interest and other required payments?
- Land values: Are assets appreciating or losing value, and are the figures nominal or adjusted for inflation?
- Income and cash flow: Are receipts and earnings keeping up with operating costs?
USDA’s current figures are forecasts for 2026, not final observed results. They describe the farm sector in aggregate, not the finances of a specific farm.
How the 1970s set up the later vulnerability
Borrowing alongside rising prices
During the 1970s, strong farm prices, expanding trade, inflation, and expectations of continued land appreciation encouraged farmers to borrow for land, equipment, and inputs. USDA describes this mix of rising income and asset values alongside growing debt as part of the period’s financial buildup. Rising interest rates later increased the cost of carrying that debt.
#1 Best Overall

- Quality toy replica of a John Deere tractor and disk tiller
- Encourages imaginative play
- Authentic design and details
- Front and rear dual tires
- Oscillating die-cast front axle
Land values climbed rapidly
USDA’s historical nominal series shows average agricultural land value rising from $197 per acre in 1970 to $737 in 1980. Those are dollars of the time; they should not be compared directly with today’s dollar values without an inflation adjustment. The rise helped support borrowing, but also meant that farms’ balance sheets depended heavily on land retaining its value.
Why the 1980s became a crisis
Prices and collateral reversed
After the 1970s run-up, farm and land prices fell. USDA reports average agricultural land value declined from $801 per acre in 1984 to $599 in 1987—a 25% nominal drop. Separately, USDA estimates farm real estate lost more than 40% of its inflation-adjusted value between 1981 and 1987. These are different measures and time windows, but both show the severity of the reversal.
Debt became harder to carry
When land values fell, the assets backing farm loans weakened. At the same time, high debt and interest costs made repayment more difficult. USDA’s historical account says the debt-to-asset ratio spiked during the mid-1980s, with defaults and farm-business failures following as financial pressure mounted. The important parallel is not simply that farmers borrowed; it is that falling asset values and expensive debt service occurred together.
Rank #2

- Toy Tractor with Grain Drill: Durable die-cast metal and plastic tractor toy that's great for both indoor and outdoor play
- Smooth Ride: Both the 7215R tractor and 1590 grain drill feature free-rolling wheels
- Authentic Tractor Replica: Featuring John Deere colors and details, this 1:64 scale model is great for both kids and collectors ages 3 and up
- Collectable Tractor: Collectors will appreciate the easy to display package and the included collector's card
- Officially Licensed John Deere Product: Produced by TOMY – Our mission is to make the world smile!
What USDA forecasts for 2026
USDA’s Economic Research Service (ERS) forecasts a large farm-sector balance sheet, with high farmland values and a modestly rising debt-to-asset ratio. Its estimates value assets as if sold in the current marketplace, rather than at their historical purchase cost. They are sector-wide estimates, not predictions of what any particular farm could sell for.
| Measure | 2026 forecast | Comparison or context |
|---|---|---|
| Total farm-sector assets | $4.47 trillion | Inflation-adjusted assets are forecast to remain relatively stable. |
| Farm-sector debt | $605.1 billion | Up 4.6% nominally and 1.5% after inflation from 2025. |
| Farm-sector equity | $3.86 trillion | Forecast to remain relatively stable after inflation. |
| Debt-to-asset ratio | 13.54% | Up from 13.34% in 2025. |
| Farm real-estate assets | $3.72 trillion | About 83% of total farm-sector assets. |
| Average farm real-estate value | $4,500 per acre | Up 0.4% after inflation from 2025. |
These 2026 figures are ERS forecasts. The debt-to-asset ratio is a measure of leverage: it compares debt with the value of assets. A rising ratio indicates that debt is growing relative to assets, but the forecast level remains far below the kind of balance-sheet stress USDA describes for the mid-1980s.
Why debt-to-asset is not the whole story
Solvency and short-term ability to pay are related but different questions. A farm may have valuable land and manageable leverage yet face a cash-flow squeeze if operating costs, interest, or scheduled payments rise faster than income. Conversely, a high debt total does not alone prove distress if earnings and collateral can support repayment.
Rank #3
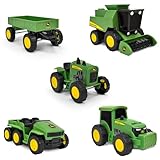
- WORKING PARTS: Each vehicle features detailed John Deere styling and real rolling wheels for realistic farm play.
- VARIETY: Five-pack includes a wagon, combine harvester, modern tractor, gator, and vintage tractor. Great for solo or group play!
- SOFT SUPER GRIP TIRES: Treaded tires spin smoothly, helping kids drive, tow, and harvest with ease during imaginative farm adventures.
- IMAGINATIVE PLAY: Perfectly sized for little hands, these 5-inch vehicles encourage pretend play and help build fine motor skills.
- FARM FUN: Ideal for farm-themed party décor, cake toppers, or as accessories in sensory bins and small-world play.
ERS forecasts working capital to rise 3.5% nominally in 2026 after a 15% decline in 2025. But other liquidity measures, including the debt-service ratio, point to worsening conditions. These indicators pull in different directions: the forecast balance sheet remains comparatively strong in aggregate, while some measures of near-term financial pressure are deteriorating.
Independent reader supportYour contribution helps us test, update, and keep practical guides available for everyone.How much of the three-decade comparison can be made?
The evidence supports a focused comparison, not a complete cycle match. The current balance-sheet and land-value forecasts show rising debt alongside valuable farmland. The historical record shows that the 1970s buildup was followed by a sharp reversal in land values and a debt-service crisis in the 1980s. But the reviewed current figures do not establish a fully comparable 2026 series for farm income, expenses, and cash receipts across all three periods.
Income comparisons need particular care. For context, ERS reported that inflation-adjusted farm-sector net cash income fell 34% from 2012 to 2016, a decline of $50.9 billion to $97.5 billion. The agency called that the largest multiyear decline since the 1970s in its 2018 account. That is a historical episode, not a current income figure or proof that today’s conditions match either earlier decade.
Rank #4

- HOBBY MODEL KIT – Unassembled model packed in an envelope with easy to follow instructions. Ideal for ages 14 and up
- HIGHLY DETAILED ETCHED MODEL – Display your 3D model once completed - collect and build them all
- FROM STEEL SHEETS TO 3D – Pop out the pieces and connect using tabs and holes. Includes illustrated instructions
- FARM TRACTOR – 2 Sheet Model with a moderate difficulty level. Once assembled, dimensions are 2.85x 1.76 x 1.76 inches.
- NO GLUE OR SOLDER NEEDED – Parts can be easily clipped from the metal sheets. Tweezers are the recommended tool for bending and twisting the connection tabs
What the sector averages mean for an individual farm
A national ratio cannot diagnose a farm’s finances. USDA has noted substantial leverage differences by farm type; commodity specialization and location also affect exposure to prices, yields, input costs, and land markets. A farm owner assessing risk should focus on their own repayment capacity, interest expense, cash reserves, debt terms, and the value and liquidity of assets—not assume the sector forecast applies to their operation.
For definitions and the forecast series, see USDA ERS’s Assets, Debt, and Wealth and Farmland Value pages. USDA NASS provides the historical land-value figures in Trends in U.S. Agriculture: Land Values. ERS’s historical comparison and 2018 financial-health account describe the earlier buildup and downturn; its charts and maps explain the historical coverage of farm-finance data.
Quick Recap
Product prices and availability are accurate as of the date/time indicated and are subject to change. Any price and availability information displayed on Amazon at the time of purchase will apply.
Quick wins for a faster PC:
Fix the driver behind crashes, sound loss and screen glitchesFind Drivers →Repair Windows errors before they cause bigger problemsFix Now →Scan for outdated or missing drivers - takes under a minuteDriver Scan →



