Free tools Windows power users keep installed
One-click scans. No signup required.
The Strait of Hormuz is a narrow sea route with an outsize role in global energy trade. In the first half of 2025, an average of 20.9 million barrels of oil a day passed through it—about one-fifth of global petroleum liquids consumption and one-quarter of maritime oil trade, according to the U.S. Energy Information Administration (EIA). A serious disruption could delay cargoes and raise shipping costs, with potential knock-on effects on energy prices. Those effects would not fall evenly: Asian markets receive most of the oil and liquefied natural gas (LNG) that crosses the strait.
Why is the Strait of Hormuz important?
Hormuz lies between Oman and Iran, connecting the Persian Gulf to the Gulf of Oman and the Arabian Sea. It is a key exit route for energy exports from Gulf producers and can accommodate the world’s largest crude oil tankers. Because so much internationally traded oil and LNG moves through one passage, a threat to safe navigation can matter well beyond the countries on its shores.
The exposure is substantial, but it is not a prediction that conflict will automatically become a global crisis. The consequences depend on whether vessels can pass safely, how long any interruption lasts, how much cargo can be rerouted, and how buyers and suppliers respond.
How much oil and LNG goes through Hormuz?
Oil and LNG figures describe different periods and measures; they should not be treated as interchangeable.
#1 Best Overall

- FOLDED EDITION - portable 8x10 inch folded size
- WORLD MAP is printed on 24lb paper
- 3D SHADED RELIEF: 3D shaded visual terrain relief for land and oceans
- PERFECT world map for business, home or educational use
- UP-TO-DATE: completely current world wall map poster
| Measure | Reported flow or share | Period and meaning |
|---|---|---|
| Oil | 20.9 million barrels per day | Average flow in the first half of 2025; equivalent to about 20% of global petroleum liquids consumption and one-quarter of global maritime traded oil, according to EIA’s 2026 analysis. |
| LNG | 11.4 billion cubic feet per day | Average flow in the first half of 2025, according to EIA’s 2026 analysis. |
| LNG | About 20% of global LNG trade | Share that traversed Hormuz in 2024, primarily originating in Qatar, according to EIA’s June 2025 analysis. |
The annual LNG trade share and the first-half-of-2025 daily flow are separate statistics, not competing estimates. EIA’s 2026 Strait of Hormuz analysis also notes that 2024 and first-quarter 2025 oil flows were more than one-quarter of global seaborne oil trade and about one-fifth of global oil and petroleum-product consumption.
Which countries depend most directly on the route?
Asian buyers receive most of the flows
In the first half of 2025, 89% of crude oil and condensate moving through Hormuz went to Asian markets. China, India, Japan, and South Korea together accounted for 74% of those flows. For LNG, 83% of Hormuz volumes went to Asia in 2024; China, India, and South Korea accounted for 52% of the LNG flows. These figures show why a disruption would be felt most directly by importers in Asia, though the precise effects would vary by buyer and available alternatives.
Rank #2

- Updated
- Each Poster 18" tall x 29" wide
- High-quality 3 MIL lamination for added durability
- Tear Resistant
The United States has a smaller direct import exposure
EIA estimates that in the first half of 2025 the United States imported about 0.4 million barrels per day of crude oil and condensate from Persian Gulf countries through Hormuz. That was about 7% of U.S. crude oil and condensate imports and 2% of U.S. petroleum liquids consumption. A smaller direct share does not insulate U.S. consumers from possible changes in global energy prices or shipping costs.
What happens if the Strait of Hormuz is closed or unsafe?
A closure is not the only way a conflict could disrupt trade. Threats to navigation or a temporary interruption could slow or divert cargoes and make shipping more costly. EIA explains that even a temporary inability to transit a major chokepoint can cause substantial supply delays and higher shipping costs, potentially raising world energy prices. Its overview of oil transit chokepoints describes this general mechanism.
Quick wins for a faster PC:
Repair Windows errors before they cause bigger problemsFix Now →Fix the driver behind crashes, sound loss and screen glitchesFind Drivers →Rank #3
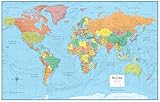
- UPDATED WORLD MAP: This map series is completely up-to-date with all current country boundaries.
- LARGE WORLD MAP: Large 32" (high) x 50" (wide) size world map is perfect for almost any wall size.
- LAMINATED WORLD MAP: Each world map is laminated on both sides with a durable 3mil lamination. Perfect for dry erase use if needed.
- WORLD MAP POSTER: Great world map poster for many uses. Home/Office decor, home schooling or even classroom use.
- SWIFTMAPS WORLD MAP: Production and Cartography by Swiftmaps - One of the leading wall map manufacturers in the United States!
- Safe passage is threatened or interrupted. Vessels may be delayed or avoid the route while conditions are uncertain.
- Deliveries take longer or cost more. Rerouting can add substantial transit time, while higher shipping costs can affect delivered cargo costs.
- Alternative supply is limited. Pipelines can bypass some, but not all, of the oil normally carried through Hormuz.
- Buyers seek available replacement cargoes. Competition for alternatives can transmit pressure into wider energy markets; the scale of this effect is not quantified by the cited EIA figures.
Physical shortages, higher freight costs, and price movements are distinct outcomes. One does not guarantee the others at a particular scale: the duration of a disruption, the amount of cargo delayed, rerouting options, and market responses all matter.
Can oil tankers avoid the Strait of Hormuz?
Some Gulf oil can move by pipeline instead of passing through the strait. EIA estimates that Saudi Arabia and the United Arab Emirates together have pipeline routes capable of bypassing about 4.7 million barrels per day. That estimated capacity is much smaller than the 20.9 million barrels per day of total oil flows through Hormuz in the first half of 2025.
Rank #4
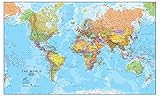
- Extra large wall map is the largest world map available as a single printed sheet: this giant map of the world measures an enormous 46 x 80 inches, with a 1:20m scale, making it an eye catching addition to any room. Perfect map for your back to school supplies.
- Updated in 2026: high level detail political map of the world features colored countries, clear towns and cities, and the world map is finished with hill and sea shading.
- Write-on world map: heat sealed between two sheets of industrial quality film, this map is laminated and perfect as a classroom world map as it can be written on with whiteboard pen and wiped clean.
- Crease-less delivery: your huge world map poster is rolled in a tube for delivery, so it arrives ready to display.
- Maps international: our philosophy of ‘cartographic excellence’ combines detail, design and high quality finishes in a range of stunning wall maps.
The 4.7 million barrels-per-day figure is estimated bypass capacity, not a guarantee that all of it is spare or available during a disruption. It indicates partial route resilience, not a full replacement for maritime transit. The cited figures do not establish an equivalent bypass for LNG.
Independent reader supportYour contribution helps us test, update, and keep practical guides available for everyone.Why do energy-flow figures change over time?
A decline in recorded flows does not, by itself, show that Hormuz has been closed or that conflict has interrupted traffic. EIA says lower oil flows since 2022 partly reflect OPEC+ production cuts, rerouting associated with Bab el-Mandeb security disruptions, and increased refining capacity in Gulf states. Production, refining, and shipping patterns can therefore change the amount passing through the strait even without a Hormuz shutdown. See EIA’s June 2025 discussion of the route’s role.
Do these 3 things before closing this tab:
1Repair Windows errors before they cause bigger problems2Fix the driver behind crashes, sound loss and screen glitches3Clear out junk files and repair common Windows errorsBest Value

- Classic Edition Decor That's Also a Real Reference: A 50" x 32" decorative-yet-functional world wall map with antique-style accents that give it an upscale, library-shelf feel while keeping the up-to-date political boundaries and place names of a current Rand McNally reference map
- Color-Matched Topographical Relief: Mountain ranges, plateaus and elevation changes shown in a coordinated color palette for at-a-glance identification of major physical features around the world
- Africa-Centered Projection: A less-common projection that allows viewers to see every continent and country complete and intact — without the splits and edge-distortions of standard Pacific- or Atlantic-centered maps
- Laminated for Durability, Rolled for Shipping: Laminated to resist scuffs and fingerprints in classrooms, offices and homes; ships rolled in a white cardboard tube with cap to arrive crease-free and ready to hang
- Trusted Since 1856 — Made in the USA: Rand McNally has been the most trusted source for maps, directions and travel content for 170 years; designed and printed in the United States
The available figures establish the route’s structural importance and explain how delays and added costs can spread. They do not predict the duration or exact scale of a hypothetical future disruption, or quantify its eventual effect on world prices.
Quick Recap
Product prices and availability are accurate as of the date/time indicated and are subject to change. Any price and availability information displayed on Amazon at the time of purchase will apply.




