Gold and silver prices respond to many of the same forces—especially expected real interest rates, the US dollar, inflation and growth expectations, and investor demand—but their different uses can send them in opposite directions. Gold has a prominent role as an investment and central-bank reserve asset; silver has a larger industrial and technology demand share. That makes silver more sensitive to the business cycle, while gold may attract demand when uncertainty rises. Neither metal has a single price-setting factor, and none of these drivers reliably predicts the next move.
What moves gold and silver prices?
Both metals trade in global markets, so expectations about monetary policy, currencies, economic conditions and investor behavior can affect them at the same time. Their prices reflect the balance of demand and available supply, but those forces interact: a dollar move may coincide with a shift in interest-rate expectations, while investment flows can magnify either response.
The World Gold Council describes gold’s 2025 performance as the result of several factors, including geopolitical and geoeconomic uncertainty, a weaker dollar, marginally lower rates, investment and central-bank demand, positioning, momentum and economic growth. Its 2026 outlook is a useful reminder that a price move should not be reduced to one headline cause.
How interest rates and the dollar affect the metals
Real interest rates and monetary policy
Gold does not pay interest. When investors expect real yields—the return on interest-bearing assets after inflation—to rise, holding gold can look less attractive by comparison; expectations of lower real yields can reduce that opportunity cost. The Federal Reserve Bank of Chicago lists real interest rates and inflation expectations among commonly cited considerations in gold pricing. The relationship is a tendency, not a rule: other demand, currency and risk factors can outweigh it. The Chicago Fed’s 2021 discussion covers these influences.
Free tools Windows power users keep installed
One-click scans. No signup required.
#1 Best Overall

- Purity: .999 Fine Silver
- Diameter: 40.6 mm; Thickness: 3.2 mm
- Stock Photo; Image is indicative of quality
- Metal Content: 1 Troy Ounce per Coin; Total: 20 Troy Ounces
- You will receive twenty coins per purchase in an official United States Mint Tube; DISCLAIMER: Please note that we pull random year coins from the same tube, so all coins received per purchase will be from the same year— mixed bags are highly unlikely, ensuring a consistent and uniform collection for your enjoyment!
The US dollar
Gold and silver are commonly quoted in US dollars. A change in the dollar can alter the metals’ dollar-denominated prices and their effective cost to buyers using other currencies. A weaker dollar may support demand, but neither metal’s price is determined by the dollar alone. The World Gold Council cited dollar weakness, along with marginally lower rates, among factors supporting gold in 2025 in its 2026 outlook.
How growth, inflation and uncertainty shape demand
Inflation can matter because it affects purchasing-power concerns and expectations for interest rates. But inflation by itself does not explain a price move: expected real yields, policy, currency movements and investor positioning may reinforce or counteract it. The Chicago Fed’s 2021 article also identifies pessimism about future macroeconomic conditions as a commonly cited consideration.
Rank #2
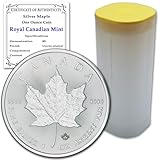
- Purity: .9999 Fine Silver
- Diameter: 38 mm; Thickness: 3.29 mm
- Metal Content: 1 Troy Ounce per Coin; Total: 10 Troy Ounces
- Stock Photo; Image is indicative of quality; Maple Tubes Available with coins while supplies last
- DISCLAIMER: Please note that we pull random year coins from the same tube, so all coins received per purchase will be from the same year— mixed bags are highly unlikely, ensuring a consistent and uniform collection for your enjoyment!
Gold can draw investment interest during geopolitical tension, financial stress or concern about purchasing power. Silver can also benefit from investor demand, but its industrial exposure means that growth expectations may matter more to its demand profile. As the World Gold Council puts it in its 2026 gold-and-silver comparison: “The metal’s dominant industrial share increases its exposure to pro-cyclical risk sentiment – raising the odds of it trading closer to industrial metals and risky assets during periods of market stress and economic deceleration.”
Why gold and silver have different demand and supply profiles
Gold: investment, reserves and a large existing stock
Gold demand includes investment, central-bank purchases, jewellery and technology. Central banks may buy or sell as part of reserve strategies, so their activity is not simply a reaction to short-term price changes. Much of the gold ever mined remains available for reuse or resale. Consequently, annual mine production is only one part of potential supply: existing gold can be recycled or reallocated when market conditions change. The World Gold Council’s 2026 edition on gold as a commodity investment discusses gold’s investment role and market characteristics.
Rank #3
- Purity: .9999 Fine Silver
- Diameter: 38 mm; Thickness: 3.29 mm
- Metal Content: 1 Troy Ounce per Coin; Total: 25 Troy Ounces
- Stock Photo; Image is indicative of quality; Coins will come with twenty-five certificates of authenticity
- You will receive twenty-five coins with an original Royal Canadian Mint acrylic tube; DISCLAIMER: Please note that we pull random year coins from the same tube, so all coins received per purchase will be from the same year— mixed bags are highly unlikely, ensuring a consistent and uniform collection for your enjoyment!
Silver: industrial use and the business cycle
Silver serves investment and consumer uses as well as industrial and technology applications. That broader industrial role ties part of its demand to manufacturing and economic activity: stronger industrial prospects can support silver, while slowing growth can weaken that source of demand. Mine output, recycling and inventories also contribute to available supply.
The Silver Institute’s World Silver Survey 2026, published in April 2026, estimated a 2025 silver market deficit of 40.3 million ounces (1,252 tonnes). The survey reported that deficit despite a 7% increase in supply and a 2% contraction in overall demand. A deficit means reported demand exceeded supply in the survey’s market accounting; it can contribute to tightness, but does not guarantee a price increase. Investment flows, inventories, substitution, recycling and expectations also matter.
Rank #4

- ✔️1 oz 2026 American Silver Eagle Coin
- ✔️Obverse: Adolph A. Weinman’s design of Lady Liberty wrapped in the American flag and elegantly striding over a ridge while the sun rises.
- ✔️Reverse: One eagle flying into land while carrying an oak branch in its talons.
Why the two prices can move differently
Shared macro forces can push gold and silver in the same direction, while differences in demand and market flows give each metal distinct sensitivities. For example, lower expected rates or a weaker dollar may support both, while stronger industrial expectations can provide an additional tailwind for silver. In a period of stress and slowing growth, gold’s defensive appeal and silver’s industrial exposure may pull them apart.
| Factor | Gold | Silver |
|---|---|---|
| Demand mix | Investment, central-bank, jewellery and technology demand are important. | Industrial and technology uses are more prominent alongside investment and consumer demand. |
| Sensitivity to growth | Investment demand may rise amid uncertainty, though gold also has consumer and industrial uses. | Manufacturing and industrial demand make it more exposed to changing business-cycle expectations. |
| Supply considerations | A large above-ground stock can be reused, recycled or resold, in addition to new mine output. | Mine output, recycling and inventories contribute to supply; the 2025 survey deficit is relevant context, not a price forecast. |
| Investor flows | Investment demand and positioning can amplify price moves. | Flows and positioning can also amplify moves; its industrial exposure can make shifts in growth sentiment especially relevant. |
Market positioning and flows can intensify a move beyond what changes in physical demand alone might suggest. The Bank for International Settlements’ March 2026 Quarterly Review describes a sharp precious-metals reversal in late January and February 2026: silver doubled during 2025, rose by more than 50% in January 2026, then fell about 30% in a single day in late January. The BIS relates the episode to changing dollar and monetary-policy expectations, retail flows into gold and silver funds, and market mechanics. It illustrates how rapidly expectations and flows can change; it does not establish that one factor caused the entire move.
Best Value

- Purity: .9999 Fine Silver
- Stock Photo; Image is indicative of quality
- Diameter: 37.97 mm; Thickness: 3.29 mm
- Metal Content: 1 Troy Ounce per Coin; Total: 5 Troy Ounces
- You will receive five coins per purchase; DISCLAIMER: Please note that we pull random year coins from the same tube, so all coins received per purchase will be from the same year— mixed bags are highly unlikely, ensuring a consistent and uniform collection for your enjoyment!
How to use these drivers when comparing the metals
For a useful comparison, ask what is changing and over what time horizon rather than treating any one indicator as a signal. Consider the demand mix, business-cycle expectations, investment flows and volatility, and the response of supply through recycling and inventories. A rate cut, supply deficit, dollar move or geopolitical shock can influence prices, but none guarantees a particular result.
Quick Recap
Product prices and availability are accurate as of the date/time indicated and are subject to change. Any price and availability information displayed on Amazon at the time of purchase will apply.




