
The best way to measure the business value of IT is to start with business outcomes, not technical activity. Define the goal, identify who owns the benefit, map the relevant business capability and process, choose a balanced set of measures, quantify financial effects carefully, and communicate the evidence in a form each decision-maker can use.
This six-step framework is based on a process associated with 4C Group and researchers connected with the University of Regensburg, as described by CIO. It is a practical model rather than a universal standard. Its central lesson is that there is no single IT-value number that works for every organization, project, stakeholder, or business situation.
As an Amazon Associate I earn from qualifying purchases.
What does “business value of IT” mean?
Business value is the measurable or defensible contribution that technology makes to organizational performance. It can include:
Do these 3 things before closing this tab:
1Scan for outdated or missing drivers - takes under a minute2Clear out junk files and repair common Windows errors3Fix the driver behind crashes, sound loss and screen glitches- Financial value: revenue growth, margin improvement, genuine cost reduction, cost avoidance, working-capital improvement, or better cash flow.
- Operational value: shorter cycle times, fewer errors, higher throughput, improved availability, reduced manual work, and better service quality.
- Customer value: improved conversion, retention, satisfaction, response time, reliability, or resolution quality.
- Employee value: less friction, greater productivity, better collaboration, and a better employee experience.
- Risk and resilience value: reduced exposure, compliance, recoverability, continuity, and avoided losses.
- Strategic value: new capabilities, faster launches, scalability, market access, and the ability to respond to change.
- Intangible value: trust, decision quality, reputation, learning, and innovation capacity.
That is broader than measuring the IT department itself. Uptime, incident volume, deployment frequency, and infrastructure cost are useful technical measures, but they become evidence of business value only when connected to an outcome that matters to the organization. IT generally enables or contributes to value alongside people, processes, business decisions, and management action; it does not automatically create value merely because a system was delivered.
#1 Best Overall

- DUAL-BAND WIFI 6 ROUTER: Wi-Fi 6(802.11ax) technology achieves faster speeds, greater capacity and reduced network congestion compared to the previous gen. All WiFi routers require a separate modem. Dual-Band WiFi routers do not support the 6 GHz band.
- AX1800: Enjoy smoother and more stable streaming, gaming, downloading with 1.8 Gbps total bandwidth (up to 1200 Mbps on 5 GHz and up to 574 Mbps on 2.4 GHz). Performance varies by conditions, distance to devices, and obstacles such as walls.
- CONNECT MORE DEVICES: Wi-Fi 6 technology communicates more data to more devices simultaneously using revolutionary OFDMA technology
- EXTENSIVE COVERAGE: Achieve the strong, reliable WiFi coverage with Archer AX1800 as it focuses signal strength to your devices far away using Beamforming technology, 4 high-gain antennas and an advanced front-end module (FEM) chipset
- OUR CYBERSECURITY COMMITMENT: TP-Link is a signatory of the U.S. Cybersecurity and Infrastructure Security Agency’s (CISA) Secure-by-Design pledge. This device is designed, built, and maintained, with advanced security as a core requirement.
The six-step framework
1. Analyze business goals and the business environment
Objective: understand what the organization is trying to achieve before selecting IT metrics.
Review the corporate strategy, annual objectives, operating plans, financial targets, customer priorities, regulatory requirements, competitive pressures, and material business risks. Separate the relevant goals into categories such as:
- Growth and revenue
- Efficiency and margin
- Resilience and continuity
- Compliance and risk reduction
- Customer or employee experience
- Innovation and speed to market
Then translate broad strategy into an observable outcome. Ask:
Free tools Windows power users keep installed
One-click scans. No signup required.
- Is the organization trying to grow, reduce cost, improve margin, or reduce risk?
- Which customer or employee journeys matter most?
- Which processes constrain growth?
- What could happen if the initiative is not funded?
- Is the investment mandatory, defensive, discretionary, or growth-oriented?
Write a one-page business-value hypothesis, for example:
By automating order validation, the company will reduce processing time and avoidable errors, increasing daily order capacity without adding headcount.
This step prevents a common mistake: choosing metrics because they are easy to collect rather than because they answer a business question. The six-step source model begins with goals and the business environment for this reason: IT cannot credibly demonstrate value without knowing what the business values. See the original framework at CIO.
2. Analyze stakeholders
Objective: determine whose definition of value matters and who must change behavior for benefits to appear.
Identify the executive sponsor, business owner, finance partner, operations leaders, users, customers, security and compliance teams, IT service owners, and any vendors or partners. For each stakeholder, record:
- The desired outcome
- The pain point being addressed
- Decision rights and influence
- Existing measures
- Adoption risks
- Their definition of success
Assign an accountable business owner to every major benefit. A project manager or IT leader can track the benefit, but the owner should usually be the person who controls the process or budget affected by the result.
| Stakeholder | Core value question | Possible measure |
|---|---|---|
| CFO or finance partner | What financial return, cost avoidance, or risk-adjusted value will result? | Cashable savings, NPV, cost per transaction |
| Business owner | Which business outcome will improve? | Cycle time, throughput, quality, revenue |
| CIO | How does the portfolio support strategy and capability? | Strategic alignment, capability health, portfolio value |
| IT operations | Are reliability and service productivity improving? | Availability, incidents, recovery time |
| End users | Does the change make work easier, faster, or safer? | Task time, adoption, employee experience |
| Board or executive committee | Is the investment improving growth, resilience, or competitiveness? | Growth, risk exposure, continuity, strategic milestones |
3. Model business capabilities
Objective: create a shared map of what the business must be able to do and where IT supports those capabilities.
A capability describes what the organization can do, not the department or system that performs it. Examples include customer acquisition, order management, product development, supply chain, finance, workforce management, and regulatory compliance.
PC Slower Than It Used to Be?
A free scan shows the junk files, broken settings and background clutter dragging Windows down - then fixes them in one click.Free scan · Windows 10 & 11Crashes, No Sound, or Screen Glitches?
Random freezes, missing sound and display glitches usually trace back to one bad driver. Find and replace yours safely.Free scan · under a minuteFor each capability affected by the initiative, document:
- Its strategic importance
- Current maturity and performance
- Process pain points
- Supporting applications, data, and services
- Dependencies and constraints
- The intended target state
Mark capabilities as differentiating, strategic, commodity, at risk, or underperforming. Then build a capability-to-outcome chain:
Rank #2
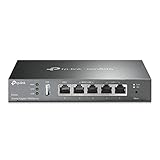
- 【Five Gigabit Ports】1 Gigabit WAN Port plus 2 Gigabit WAN/LAN Ports plus 2 Gigabit LAN Port. Up to 3 WAN ports optimize bandwidth usage through one device.
- 【One USB WAN Port】Mobile broadband via 4G/3G modem is supported for WAN backup by connecting to the USB port. For complete list of compatible 4G/3G modems, please visit TP-Link website.
- 【Abundant Security Features】Advanced firewall policies, DoS defense, IP/MAC/URL filtering, speed test and more security functions protect your network and data.
- 【Highly Secure VPN】Supports up to 20× LAN-to-LAN IPsec, 16× OpenVPN, 16× L2TP, and 16× PPTP VPN connections.
- Security - SPI Firewall, VPN Pass through, FTP/H.323/PPTP/SIP/IPsec ALG, DoS Defence, Ping of Death and Local Management. Standards and Protocols IEEE 802.3, 802.3u, 802.3ab, IEEE 802.3x, IEEE 802.1q
IT capability → business capability → process change → business outcome → measureFor example:
Workflow automation → internal support capability → automated routing → shorter handling time → lower cost per caseCapability mapping gives business and IT a common language. It also shows why two projects with similar technology costs can have very different value: they may affect capabilities with very different strategic importance.
4. Model business–IT relationships
Objective: show the causal chain between IT investment, business activity, and performance.
Recommended Free Tools
Map the initiative through the following sequence:
IT investment
  ↓
IT capability or service
  ↓
Business capability
  ↓
Process or customer journey
  ↓
Adoption and behavior change
  ↓
Operational outcome
  ↓
Financial, strategic, customer, or risk value
Document:
- Which applications and services support the business capability
- Which process steps or customer journeys change
- Who uses the new capability
- What training, policy, staffing, data, or vendor changes are required
- Which benefits IT directly enables and which require joint ownership
The resulting benefit dependency map should identify what IT provides, who uses it, what changes in the business, which outcome should move, who owns that outcome, and how it will be measured.
This is also where attribution must be handled honestly. If a new platform coincides with process redesign, training, pricing changes, and market growth, saying “IT caused the improvement” may be too strong. “IT enabled” or “IT contributed to” is often more defensible. Research summarized by INFORMS emphasizes that technology benefits depend on business action and complementary organizational capabilities.
5. Measure the value proposition
Objective: select a small, balanced set of measures tied to a stakeholder, scenario, activity, and outcome.
Start with the business outcome and work backward to the IT contribution. Do not begin with whichever technical data is easiest to export.
What’s actually slowing this PC down?
Pick the symptom - the matching free tool is one click away.
A practical metric hierarchy
- Strategic outcome: revenue growth, margin, retention, risk exposure, or launch speed.
- Business or process outcome: cycle time, throughput, cost per transaction, defect rate, resolution rate, or employee productivity.
- IT contribution: availability, automation, adoption, recovery time, incident volume, deployment speed, or data latency.
Use a few outcome measures supported by diagnostic measures. A dashboard with dozens of disconnected KPIs can obscure rather than prove value.
Financial measures
Common formulas include:
ROI = (Total benefits − Total costs) ÷ Total costsNet benefit = Total quantified benefits − Total costsPayback period = Initial investment ÷ Periodic net benefitFor longer-lived investments, use discounted cash flows and NPV where assumptions are reliable. NPV is more informative than an undiscounted return when costs occur early and benefits arrive over several years, although it becomes less precise when benefits are intangible or uncertain. A broader discussion of IT-value measurement and aggregation appears in Springer Nature.
Calculate total cost of ownership rather than counting only license prices. Include implementation, integration, migration, internal labor, external services, training, support, security, change management, infrastructure or cloud consumption, and retirement or exit costs.
Do not confuse financial categories
- Cost saving: spending actually falls.
- Cost avoidance: a future expense may not occur; this is not the same as a current budget reduction.
- Productivity benefit: capacity or time is released, but it becomes cash saving only if staffing, overtime, contractor use, or another financial mechanism changes.
- Revenue benefit: additional sales or retention may be partly attributable to IT but usually also depend on marketing, pricing, sales, and operations.
- Risk reduction: expected loss may fall even when no immediate revenue appears.
Operational, customer, risk, and qualitative measures
Depending on the initiative, consider:
- Operations: transaction time, service-request fulfillment, incident volume, mean time to restore, outage frequency, manual effort, rework, and capacity.
- Customers: satisfaction, retention, conversion, abandonment, resolution time, contact volume, and first-contact resolution.
- Risk: control exceptions, vulnerability exposure, recovery-time objective achievement, recovery-point objective achievement, compliance findings, and probability-weighted loss exposure.
- Qualitative value: stakeholder confidence, employee experience, ease of use, trust in data, decision quality, and perceived agility.
Qualitative value is not automatically unmeasurable. Define the population, use a consistent scale, measure before and after, disclose the response rate, and report uncertainty. Monetization may remain inappropriate, but structured evidence is still useful.
Baseline and target rules
Every important metric should have:
- A precise definition
- A named owner
- A data source
- A baseline period
- A target and success threshold
- A measurement frequency
- Known exclusions
- A date by which the benefit should appear
Use pre-implementation or historical data where possible. ServiceNow’s documentation on business-value reports also distinguishes incremental value from overall value, an important distinction when other factors affect the result.
6. Plan communication of the results
Objective: present the same evidence in a form each audience can use to make decisions.
Executive scorecard
- Business objective
- Expected outcome
- Baseline, current result, and target
- Financial impact
- Confidence level
- Key assumption
- Decision required
- Next review date
Business-owner view
Show process performance, adoption, bottlenecks, benefits at risk, and the actions required from the business.
Rank #3

- WiFi 6 Mesh Wi-Fi - Next-gen Wi-Fi 6 AX3000 whole home mesh system to eliminate weak Wi-Fi for good(2×2/HE160 2402 Mbps plus 2×2 574 Mbps)¹²
- More than a WiFi Router - Deco X55 can work as a standalone Wi-Fi Router. All the TP-Link Deco Mesh can work together. Better than traditional WiFi Router and Range Extender
- Whole Home WiFi Coverage - Covers up to 2500 square feet with 1 Deco X55. Simply add more Deco if you need more coverage. Enjoy seamless high-performance Wi-Fi 6 and eliminate dead zones and buffering¹
- Our Cybersecurity Commitment - TP-Link is a signatory of the U.S. Cybersecurity and Infrastructure Security Agency’s (CISA) Secure-by-Design pledge. This device is designed, built, and maintained, with advanced security as a core requirement
- More Gigabit Ports - Each Deco X55 has 3 Gigabit Ethernet ports(6 in total for a 2-pack) and supports Wired Ethernet Backhaul for better speeds. Any of them can work as a Wi-Fi Router
IT view
Show service performance, reliability, capacity, technical debt, delivery progress, cost, utilization, and dependencies.
The Tool Desk
Outbyte PC Repair FREERepair Windows errors before they cause bigger problemsFix Now →Outbyte Driver Updater FREEFix the driver behind crashes, sound loss and screen glitchesFind Drivers →Finance view
Separate cashable savings, cost avoidance, one-time costs, recurring costs, benefit timing, accounting treatment, assumptions, sensitivity ranges, and attribution limits.
The source model treats communication as a distinct sixth step because quantitative and qualitative evidence must be presented differently. A technically accurate dashboard can still fail if it does not answer the audience’s decision question.
Worked examples
Service-desk automation
- Goal: increase support capacity without increasing staffing.
- Stakeholders: service-desk leadership, finance, IT operations, employees, and end users.
- Capability: internal support and employee productivity.
- Relationship: automated routing and self-service lead to shorter handling time.
- Measures: self-service adoption, cost per ticket, first-contact resolution, average handling time, employee satisfaction, and reopen rate.
- Communication: monthly operational reporting and quarterly financial-value review.
A reduction in handling time is not automatically a labor saving. It becomes cashable only if the organization reduces overtime, contractors, staffing costs, or another expense—or converts the released capacity into measurable additional output.
Cloud migration
Measure more than the old infrastructure bill versus the new invoice. Include migration and integration costs, consumption, idle capacity, utilization, support, security, resilience, portability, exit costs, and speed benefits. A migration may create strategic or resilience value even if the first-year technology cost is not lower.
Quick wins for a faster PC:
Fix the driver behind crashes, sound loss and screen glitchesFind Drivers →Clear out junk files and repair common Windows errorsFree Scan →Cybersecurity or resilience investment
The primary benefit may be avoided loss or continued operation rather than revenue. Use threat scenarios, probability-weighted expected loss, control coverage, recovery performance, regulatory exposure, and critical-dependency analysis. Do not force a mandatory security investment into an artificial payback period.
Customer-facing digital product
Connect the IT contribution to conversion, abandonment, retention, response time, customer satisfaction, and revenue. Use a control group or before-and-after comparison where practical, while recognizing that pricing, promotions, seasonality, and marketing may also affect results.
AI or workflow automation
Track adoption, accuracy, exception rates, human review time, rework, control effectiveness, error impact, change-management cost, and unit economics at actual volume. “Time saved” is not enough if review work, error correction, or risk increases.
Shared infrastructure or workplace IT
For commodity services such as identity, hosting, networks, and workplace technology, use business-service availability, user productivity, incident impact, recovery performance, cost per user or transaction, risk reduction, and satisfaction. Direct revenue attribution may be inappropriate, but the service can still have measurable operational and resilience value.
How to prove benefits were realized
Delivery is an output; realization is an outcome. Establish a benefits-realization cycle:
- Before investment: record the baseline, target, assumptions, owner, and measurement method.
- During implementation: track readiness, training, process redesign, data quality, and adoption risks.
- At launch: confirm that the capability works and that users are adopting it.
- After stabilization: compare results with the baseline and isolate the effect of other changes.
- At review: validate financial effects with finance and assign corrective actions for benefits at risk.
Where practical, use a comparison group, a before-and-after analysis, difference-in-differences, sensitivity ranges, explicit contribution percentages, and a confidence rating. The more factors changed at the same time, the more cautious the attribution should be.
Independent reader supportYour contribution helps us test, update, and keep practical guides available for everyone.Common failure modes
Starting with technical metrics
Problem: reporting uptime, tickets, releases, or infrastructure cost without business relevance.
Fix: begin with the business objective and show which outcome each technical measure supports.
Rank #4

- 【Flexible Port Configuration】1 2.5Gigabit WAN Port + 1 2.5Gigabit WAN/LAN Ports + 4 Gigabit WAN/LAN Port + 1 Gigabit SFP WAN/LAN Port + 1 USB 2.0 Port (Supports USB storage and LTE backup with LTE dongle) provide high-bandwidth aggregation connectivity.
- 【High-Performace Network Capacity】Maximum number of concurrent sessions – 500,000. Maximum number of clients – 1000+.
- 【Cloud Access】Remote Cloud access and Omada app brings centralized cloud management of the whole network from different sites—all controlled from a single interface anywhere, anytime.
- 【Highly Secure VPN】Supports up to 100× LAN-to-LAN IPsec, 66× OpenVPN, 60× L2TP, and 60× PPTP VPN connections.
- 【5 Years Warranty】Backed by our 5-years warranty and free technical support from 6am to 6pm PST Monday to Fridays
Measuring too many KPIs
Problem: the dashboard becomes a data warehouse.
Fix: choose a small set of outcome measures and use technical metrics as diagnostics.
Counting productivity as cash savings
Problem: hours saved are multiplied by salary and reported as realized savings.
Fix: label the result as released capacity or theoretical productivity unless a financial result is actually achieved.
Measuring only at project close
Problem: benefits are assumed to exist because the system went live.
Free tools Windows power users keep installed
One-click scans. No signup required.
Fix: continue measurement after launch and track adoption and process change.
Ignoring adoption
Problem: the technology works, but employees keep using the old process.
Fix: include usage, workflow compliance, training, and change-management measures.
Double-counting shared-platform benefits
Problem: multiple projects claim the same downstream benefit.
What’s actually slowing this PC down?
Pick the symptom - the matching free tool is one click away.
Fix: allocate benefits to distinct outcomes, document dependencies, and reconcile the total with finance.
Using vendor benchmarks as forecasts
Problem: a sponsored case study or commissioned economic study is treated as a guaranteed result.
Fix: use external results as directional inputs and replace them with your own baseline and assumptions. Even vendor value materials advise organizations to use customer-specific estimates; see the caveats in this ServiceNow/Forrester report.
A practical business-value charter
| Field | Example |
|---|---|
| Initiative | Customer-service workflow automation |
| Business objective | Reduce service cost while improving response time |
| Primary business owner | VP Customer Operations |
| IT owner | CIO or service owner |
| Baseline | 18-minute average handling time |
| Target | 12 minutes within six months |
| Business outcome | Greater capacity and lower cost per case |
| IT contribution | Automated routing and knowledge suggestions |
| Adoption assumption | 85% of agents use the new workflow |
| Financial method | Cost per case multiplied by volume and realized capacity change |
| Review cadence | Monthly during rollout; quarterly after stabilization |
| Confidence | Medium until adoption and quality data mature |
Choosing tools without mistaking dashboards for value
Spreadsheets and general business-intelligence tools may be sufficient for a small portfolio. Larger organizations may need IT financial management, strategic portfolio management, service analytics, or consulting support. Examples include Power BI, Tableau, ServiceNow Strategic Portfolio Management, IBM Apptio Technology Business Management, and Planview Portfolios. These are examples, not recommendations.
Judge any tool by its data-to-decision fit:
- Can it connect financial, operational, project, and adoption data?
- Can it preserve definitions and baselines?
- Can it assign benefit ownership?
- Can it distinguish actuals from estimates?
- Can it show assumptions and confidence?
- Can business users access the results?
- Can it prevent double-counting?
- Can it support ongoing realization rather than one-time business-case reporting?
A polished dashboard cannot repair weak baselines, unclear ownership, poor adoption, or unsupported attribution.
Quick Recap
Measurement checklist
- Define the business objective before selecting IT KPIs.
- Identify the stakeholders and assign a business owner for each benefit.
- Map the IT service to a business capability and process.
- Record the baseline, target, data source, and measurement date.
- Use outcome, contribution, adoption, and diagnostic measures together.
- Separate savings, cost avoidance, productivity, revenue, and risk reduction.
- Include total cost of ownership.
- State assumptions, uncertainty, and attribution limits.
- Check for double-counting across shared platforms and portfolios.
- Measure after implementation, not only at project close.
- Tailor the communication to executives, finance, business owners, and IT teams.
Product prices and availability are accurate as of the date/time indicated and are subject to change. Any price and availability information displayed on Amazon at the time of purchase will apply.




