
The fairest way to compare Asian Paints with Indian paint stocks is to start with consolidated, audited annual numbers, then adjust for business mix, growth quality, profitability, capital efficiency, cash generation, competitive position and valuation. Asian Paints is the scale reference in a concentrated market: a SEBI filing groups Asian Paints, Berger Paints and Kansai Nerolac as holding more than approximately 80% of the market. That scale does not automatically make it the best investment. A smaller company can grow faster, while an industrial-heavy company can show different margins for structural reasons.
This guide sets out a repeatable framework using the cited FY2019-FY2024 growth data and Asian Paints’ reported FY2025-26 operating figures. It also explains which comparisons are unsafe, how to normalize the numbers, and why a current price and consensus-data check is required before drawing a valuation conclusion.
As an Amazon Associate I earn from qualifying purchases.
Start with a comparable peer set and accounting basis
Use Asian Paints, Berger Paints, Kansai Nerolac, Indigo Paints and Akzo Nobel India as the core listed peer group. Add JSW Paints or another entrant only when its period, consolidation scope and disclosure basis match the other companies. Mixing a parent-only number with a consolidated number, or a nine-month period with a full year, can make a weak comparison look precise.
Use consolidated, audited annual statements
For each company, collect the same line items from consolidated audited annual reports:
#1 Best Overall
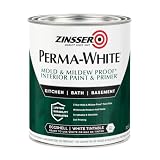
- Self-Priming formula - requires no sanding
- Mold & Mildew-Proof paint film - guaranteed for 5 years
- Resists dirt and moisture on film coating
- Finish is washable and scrubbable with soap and water
- Product contains a mildewcide to prevent the growth of mold and mildew on the paint film only
- Revenue from operations
- Cost of materials and gross profit
- EBITDA and EBITDA margin
- Profit after tax, diluted earnings per share and operating cash flow
- Net debt or net cash
- Capital employed, ROCE and ROE, using the company’s stated definitions
- Decorative, industrial and international segment revenue where disclosed
Record the financial year-end and currency before calculating a ratio. Indian paint companies generally report in rupees, but the unit may be lakh, crore or million; convert all figures to one unit. Do not combine standalone Asian Paints figures with consolidated Berger or Nerolac figures.
Keep the period consistent
The cited SEBI table compares FY2019 through FY2024 revenue. That is a five-year interval with six year-end observations. If you calculate CAGR yourself, use the interval between FY2019 and FY2024, not six years: CAGR = (FY2024 revenue / FY2019 revenue)^(1/5) - 1. A company’s latest annual report may cover FY2025 or FY2025-26, but that newer year should be shown separately rather than silently blended into the historical table.
What the historical growth data actually shows
The cited SEBI table reports materially different FY2019-FY2024 revenue CAGRs. Indigo Paints had the highest rate among the named companies, while Kansai Nerolac had the lowest. A high CAGR is a screening result, not proof of superior economics: it may reflect a smaller starting base, acquisitions, price increases, or a different segment mix.
| Company | FY2019-FY2024 revenue CAGR | How to use the figure |
|---|---|---|
| Asian Paints | 13.02% | Large-scale benchmark for the peer group |
| Berger Paints | 13.06% | Near-identical reported CAGR to Asian Paints in the cited period |
| Kansai Nerolac | 7.54% | Needs industrial/decorative mix analysis before a margin or growth judgment |
| Akzo Nobel India | 6.30% | Compare with its segment and geographic disclosures |
| Indigo Paints | 21.72% | Fastest CAGR in the cited table; test base effects and durability |
| JSW Paints | FY2024 revenue of ₹20.97 billion in the cited table | Do not calculate a like-for-like CAGR without a comparable starting year and basis |
Separate volume, price and mix
Revenue growth is the combination of physical volume, selling prices and product mix. A company can report strong revenue while volumes are flat if it raises prices or sells more premium products. Conversely, volume can rise while revenue growth is modest during a price decline. For each annual report, create a bridge with like-for-like volume growth, price realization and mix, but only where management provides a clearly defined measure.
Check whether growth came from decorative paints, industrial coatings, international subsidiaries or home décor. International revenue can be affected by currency translation, while industrial revenue can follow automobile, infrastructure or manufacturing cycles rather than repainting demand. These are not interchangeable growth streams.
Normalize profitability before comparing margins
EBITDA margin is useful only when the numerator, denominator and business mix are comparable. Start with EBITDA divided by consolidated revenue, then investigate gross margin, employee costs, advertising, distribution expenses and other operating items. Note exceptional gains or losses and whether a company presents an adjusted EBITDA measure.
Rank #2

- PAINT + PRIMER IN ONE: Evolve’s paint-and-primer formula helps you get great coverage from the start, sealing your surface and reducing the extra work of multiple coats.
- AVAILABLE IN MULTIPLE SHEENS, COLORS & SIZES: Choose from a curated palette of designer colors in Flat, Eggshell, Satin, and Semi-Gloss sheens to match any style, room, or project. Available in 1-Gallons & 5-Gallons.
- EGGSHELL SHEEN – Soft, Velvety Glow: Offers a gentle sheen that balances elegance with durability. Ideal for moderate-traffic areas like dining rooms, hallways, and family rooms. Easy to clean without compromising the finish.
- STAIN & SCRUB RESISTANT: Built to last in real spaces, Evolve helps resist marks, scuffs, and water spotting, so your home continues to look polished and well-maintained.
- DESIGNED FOR MOISTURE-PRONE AREAS: Formulated to perform well in bathrooms, kitchens, entryways, laundry rooms, and other high-humidity spaces.
Asian Paints’ reported reference figures
Asian Paints’ FY2025-26 annual-report page gives EBITDA of ₹7,113.1 crore, identified there as “Asian Paints Limited, FY2025-26.” The same cited material reports 28.4% ROCE for FY2025, identified as “Asian Paints Limited, FY2025.” Because the labels refer to different reporting years, do not present them as one single-year pair without checking the underlying annual report definitions.
Quick wins for a faster PC:
Repair Windows errors before they cause bigger problemsFix Now →Scan for outdated or missing drivers - takes under a minuteDriver Scan →Clear out junk files and repair common Windows errorsFree Scan →Use a margin-quality checklist
- Compare gross margin and EBITDA margin together; a high EBITDA margin built on unusually favorable raw-material costs may not persist.
- Chart each company’s margin over several years to identify volatility rather than relying on one peak year.
- Separate reported EBITDA from adjusted EBITDA and list every adjustment.
- Check whether depreciation, lease costs or other items are treated consistently across peers.
- Relate margins to decorative, industrial and international mix before ranking companies.
Raw-material prices, especially for petrochemical-linked inputs, can move margins across the industry. A margin expansion during falling input costs is economically different from expansion caused by durable pricing power or premiumization.
Measure ROCE, ROE and cash conversion on the same definitions
Capital efficiency answers a different question from profitability: how much operating profit is produced for the capital tied up in the business. Use each company’s stated ROCE formula first, then build a common supplemental calculation if the inputs are available.
ROCE and ROE
ROCE is commonly calculated using operating profit divided by capital employed, but companies differ on whether they use average or closing capital employed and which profit measure is in the numerator. ROE uses profit attributable to shareholders divided by equity, with the same average-versus-closing issue. Keep the reported ratio and your normalized ratio in separate columns.
The cited Asian Paints figure of 28.4% ROCE is a useful reference point, but it should not be compared with a peer’s ratio until the period, scope and formula match. A company with substantial goodwill, leases or a large international business may have a different capital denominator even when its operating economics are similar.
The Tool Desk
Outbyte PC Repair FREERepair Windows errors before they cause bigger problemsFix Now →Outbyte Driver Updater FREEScan for outdated or missing drivers - takes under a minuteDriver Scan →Operating cash conversion
Calculate operating cash flow divided by EBITDA and operating cash flow divided by profit after tax. Investigate persistent gaps caused by inventory, receivables, payables, tax timing or capitalized costs. A one-year gap can be working-capital timing; a multi-year gap deserves a deeper explanation.
Rank #3

- Use for a variety of indoor and outdoor project surfaces including wood, metal, plaster, masonry or unglazed ceramic
- Water-based acrylic formula is low odor, resist chips and provides long-lasting protection
- Covers up to 120 sq ft and dries to touch in 30 minutes for quick project completion
- Semi-gloss finish minimizes surface imperfections, goes on smoothly and provides excellent hide
- Prior to application sand surfaces with 180/200 grit sandpaper, then wash with a degreaser, allow the surface to dry and apply paint
| Metric | Basic calculation | Question it answers |
|---|---|---|
| EBITDA margin | EBITDA ÷ revenue | How much operating profit is generated before depreciation and finance costs? |
| ROCE | Operating profit ÷ capital employed, using the company’s stated basis | How efficiently is operating capital used? |
| ROE | Profit attributable to owners ÷ equity, using a consistent average/closing basis | What return is earned on shareholder capital? |
| Cash conversion | Operating cash flow ÷ EBITDA or profit after tax | How much reported profit becomes operating cash? |
| Net debt/EBITDA | Net debt ÷ EBITDA | How much balance-sheet risk accompanies the earnings? |
Adjust for decorative, industrial and international mix
Asian Paints is predominantly a decorative and home-décor company. Its FY2025-26 annual-report page reports decorative and home-décor revenue of ₹30,830.4 crore, equal to 86.8% of revenue, both identified there as FY2025-26 figures. This mix makes Asian Paints a useful decorative-market reference, but it also means an industrial-heavy peer should not be judged by an unadjusted margin comparison.
Kansai Nerolac’s official 2024 release estimates India’s domestic paint industry at about ₹75,000 crore as of March 2024. The company’s industrial exposure means its segment mix must be separated before comparing margins, growth or cyclicality with a predominantly decorative business.
Build a mix table for every peer
| Business area | What to record | Why it matters |
|---|---|---|
| Decorative | Revenue, volume, price/mix and margin where disclosed | Linked to repainting, new construction, dealer reach and consumer demand |
| Industrial | Revenue, customer sectors and margin where disclosed | Can track automobile, infrastructure and manufacturing cycles |
| International | Revenue, constant-currency growth and reported growth | Currency and country conditions can distort rupee growth |
| Home décor or adjacent products | Revenue and profitability separately where available | May carry different margins, working capital and competitive dynamics |
Compare like with like first: decorative against decorative and industrial against industrial. Then evaluate the consolidated company as an allocation decision. A lower consolidated margin may be acceptable if the company is deliberately building a faster-growing business, but the investment case should identify that trade-off explicitly.
Assess competitive position beyond a market-share headline
The SEBI filing says Asian Paints, Berger Paints and Kansai Nerolac together held over approximately 80% of the market. That indicates a concentrated industry, not a guarantee that each company’s share is stable. Market-share data can be measured by value or volume, may cover only a defined category, and may come from different periods.
Dealer and tinting reach
Review dealer count, geographic coverage, stockist productivity and the installed base of tinting machines when companies disclose them. Tinting capacity can support a wider shade range and reduce the need to hold every finished shade in inventory, but the financial benefit depends on utilization and channel economics. Do not treat a larger dealer number as proof of higher returns without checking sales per outlet and working-capital requirements.
Product breadth and brand position
Map products across economy, mainstream and premium decorative coatings, waterproofing, wood finishes, adhesives, construction chemicals and décor. Product breadth can increase wallet share, yet adjacent categories may have different competitive intensity and margins. Identify whether growth comes from established products or newly added categories that still require advertising and distribution investment.
Rank #4

- ALL-IN-1 PAINT & PRIMER: A hardy multi-purpose and multi-surface one-coat paint and primer in one for almost any indoor or outdoor surface. A wall, ceiling, floor, skirting board, cabinet, furniture and door paint for your bathroom, kitchen, home and garden.
- DURABLE & VERSATILE: A highly pigmented, thick formula available in 12 bold colors and a Matte, Satin or Gloss finish. Ideal for interior and exterior paint jobs on wood, laminate, plastic/UPVC, metal, concrete, brick, masonry, stone, glass and more.
- EFFECTIVE MONEY & TIME SAVER: A quick painting solution for DIY or professional builders and painters; our luxuriously opaque formula requires just 1 coat and is fast drying for a premium finish.
- ADVANCED ECO FORMULA: Our UK-made chalk paint is water-based, non-toxic, low odor, and has low VOCs for an environmentally friendly decorating choice.
- EASY APPLICATION: Remove dirt with a damp cloth, wipe the surface clean and dry, sand/score the surface (optional based upon the finish required), stir to mix the color and paint with a brush or roller.
Repainting versus new construction
Repainting demand is linked to household maintenance and renovation cycles; new construction is linked to housing completions and project activity. A company with greater repainting exposure may have a different demand pattern from one concentrated in new construction or industrial projects. Use management’s disclosed split where available rather than assigning a precise percentage from general industry assumptions.
What’s actually slowing this PC down?
Pick the symptom - the matching free tool is one click away.
Read the industry cycle and raw-material risk
Asian Paints’ FY2024-25 annual report describes the year as challenging and says the coatings industry recorded revenue decline ranging from low single-digit degrowth to flat performance. That statement is important context when interpreting a single year of weak revenue or margin pressure: an industry-wide slowdown is different from a company-specific loss of share.
For each peer, create a timeline of selling prices, key input-cost trends, gross margin and volume. Test three situations:
- Input-cost inflation: Can the company pass higher costs through pricing, and how long does the lag last?
- Input-cost decline: Does the company retain part of the benefit through margin expansion or compete it away through lower prices?
- Weak demand: Does volume hold up because of repainting exposure, premium products or dealer strength?
Competitive pricing deserves separate attention. A market leader may defend distribution and share by accepting lower near-term margins, while a challenger may spend more on advertising and channel incentives. Compare selling and distribution expense as a percentage of revenue across years, not just the absolute amount.
Independent reader supportYour contribution helps us test, update, and keep practical guides available for everyone.Compare valuation only after normalizing the operating data
Use price-to-earnings, EV/EBITDA and price-to-book only after the growth, margin, mix, cash and balance-sheet work is complete. The available material does not provide a live multiple or current consensus estimate, so it cannot establish whether Asian Paints currently trades at a justified premium or discount.
Recommended Free Tools
A practical valuation worksheet
- Record the current share price, diluted shares outstanding and market capitalization on the same date for every company.
- Add total debt and subtract cash and liquid investments to calculate enterprise value, using a consistent treatment of leases and minority interests.
- Use trailing twelve-month and forward earnings separately; label the fiscal year and the consensus source.
- Calculate P/E, EV/EBITDA and price-to-book for each peer.
- Compare each multiple with its own historical range and with peers that have similar growth, mix and ROCE.
- Run a sensitivity table for slower revenue growth, lower EBITDA margin and a higher cost of capital.
| Valuation measure | Best used when | Main pitfall |
|---|---|---|
| P/E | Earnings are positive and accounting policies are reasonably comparable | Can mislead when one company has unusually high or low tax, exceptional items or cyclical profits |
| EV/EBITDA | Comparing businesses with different debt levels | Ignores capital intensity, leases, taxes and working-capital needs |
| Price-to-book | Asset and capital structures are meaningful and book values are comparable | Brand value and internally built intangibles may not appear on the balance sheet |
A premium multiple can be rational when a company combines durable growth, high and stable ROCE, strong cash conversion, defensive mix and low balance-sheet risk. It is vulnerable when the premium assumes uninterrupted market-share gains, peak margins or a growth rate that smaller competitors cannot sustain.
Best Value

- WHAT'S IN THIS 10 PIECE PAINT KIT FOR WALLS: includes one plastic paint tray; one 9 inch roller frame; one 4 inch mini roller frame; two 9 inch microfiber roller covers (1/2 inch nap); two 4 inch microfiber roller covers (1/2 inch nap); one 1 inch flat brush; one 1.5 inch angle sash brush; one 2 inch angle sash brush
- Versatile Application: Perfect for any project, this set includes paint rollers 9 inch for large surfaces and smaller brushes for detail work
- All-in-One Kit: This paint brush set and paint tray combo ensures you have all the paint supplies needed for any home improvement task
- Professional Grade: Get a smooth, even finish with our high-quality paint roller set; ideal for applying interior paint gallon or smaller quantities
- Cost-Effective: This paint brush and roller set provides unbeatable value; includes paint pan and paint trays for easy cleanup and reuse
Use a scorecard instead of one “best stock” metric
Build a five-part scorecard and write the evidence beside every score. Avoid giving a high score when the underlying disclosure is not comparable.
- Growth quality: Revenue CAGR, like-for-like volume, price/mix and the durability of the end markets.
- Profitability: EBITDA margin, gross margin, volatility and the explanation for changes.
- Capital efficiency: ROCE, ROE, operating cash conversion and reinvestment needs.
- Competitive position: Dealer reach, tinting infrastructure, product breadth, brand strength and market-share direction.
- Valuation and risk: P/E, EV/EBITDA, price-to-book, net debt, raw-material sensitivity and execution risk.
Use a written investment thesis such as: “The company earns a premium because its decorative mix, stable ROCE and cash conversion justify it, provided volume growth recovers.” Then list what would disprove the thesis, such as sustained volume decline, margin compression, deteriorating cash conversion or a valuation that already discounts optimistic growth.
Common comparison errors and how to correct them
Ranking by revenue CAGR alone
Correction: pair CAGR with starting size, volume growth, price/mix and cash generation. Indigo Paints’ 21.72% FY2019-FY2024 CAGR is notable, but the table alone does not show whether the rate came from volume, price, acquisitions or a smaller base.
Free tools Windows power users keep installed
One-click scans. No signup required.
Comparing industrial and decorative margins without adjustment
Correction: separate segment results and compare each segment with its closest peers before judging consolidated margins.
Mixing annual and quarterly numbers
Correction: use audited annual data for the core comparison, then use quarterly results only as a clearly labeled update.
Using a market-share figure without its definition
Correction: record the category, geography, value-versus-volume basis and measurement date. The “over approximately 80%” figure applies to the combined position of Asian Paints, Berger Paints and Kansai Nerolac in the cited SEBI filing.
Treating a reported ROCE as universally comparable
Correction: preserve each company’s stated formula and calculate a supplemental common ratio only when the required inputs are available.
Crashes, No Sound, or Screen Glitches?
Random freezes, missing sound and display glitches usually trace back to one bad driver. Find and replace yours safely.Free scan · under a minuteWindows Errors? Fix Them Before They Spread
Repair common Windows errors and clear accumulated junk for a smoother, more stable PC - no reinstall needed.Free scan · no reinstallDeclaring a valuation winner without current prices
Correction: refresh prices, share counts and consensus estimates at the publication date. Historical revenue CAGRs cannot establish a current investment recommendation.
A repeatable annual review process
- Download the latest consolidated annual reports and note the fiscal year, reporting currency and segment definitions.
- Enter five years of revenue, EBITDA, profit, operating cash flow, capital employed, equity, debt and cash.
- Calculate CAGR, margins, ROCE, ROE, cash conversion and leverage using documented formulas.
- Build the decorative, industrial, international and adjacent-business mix table.
- Read the management discussion for volume, price/mix, raw materials, channel conditions and competitive intensity.
- Check whether market-share and dealer data use the same period and category across companies.
- Update current valuation multiples and consensus estimates, clearly labeling trailing and forward figures.
- Write the bull case, bear case and the measurable indicators that would change your view.
This process keeps the comparison anchored to reported evidence while allowing a fresh valuation decision. It also prevents a single attractive number—whether growth, margin or market share—from dominating the analysis.
Quick Recap
Product prices and availability are accurate as of the date/time indicated and are subject to change. Any price and availability information displayed on Amazon at the time of purchase will apply.




