
For CoreWeave stock, the most informative dashboard combines six layers: revenue growth and quality; GAAP losses versus adjusted results; backlog conversion; power, GPUs, capex and depreciation; debt and interest; and cash flow, customer concentration and execution. CoreWeave’s second quarter of 2026 shows why all six are necessary: sales are expanding rapidly, but financing costs, heavy investment and GAAP losses remain material.
The latest quarter in one view
CoreWeave’s latest cited official quarter ended June 30, 2026. The figures below establish the starting point for a monitoring dashboard. They come from company-reported results and should be read with the qualifications in the sections that follow.

As an Amazon Associate I earn from qualifying purchases.
| Metric | Q2 2026 result | What it tells an investor |
|---|---|---|
| Revenue | $2.575 billion, versus $1.212 billion in Q2 2025 | Top-line scale and year-over-year growth |
| GAAP operating loss | $49 million | Profitability after operating costs, depreciation and other GAAP items |
| GAAP net loss | $626 million | What remains after interest and other non-operating costs |
| Net interest expense | $640 million | The financing burden that sits below operating profit |
| Diluted net loss per share | $1.14 | Loss attributable to each diluted share |
| Adjusted EBITDA | $1.510 billion; 59% adjusted margin | Management’s non-GAAP view of operating earnings before selected costs |
| Adjusted operating income | $128 million; 5% adjusted margin | A closer bridge between adjusted performance and operating profit |
| Revenue backlog | Approximately $104 billion at June 30 | Contracted revenue visibility, not immediate cash |
| Active power | 1.5 gigawatts | Power capacity currently supporting deployed operations |
| Contracted power | Approximately 3.7 gigawatts | Future capacity commitments that still require delivery |
The central message is not that one number is “good” or “bad.” It is that exceptional revenue growth and a high adjusted EBITDA margin coexist with a GAAP operating loss, a large net loss and interest expense that exceeded operating income. A stockholder should therefore track the relationships among these numbers, not an isolated headline percentage.
Do these 3 things before closing this tab:
1Scan for outdated or missing drivers - takes under a minute2Clear out junk files and repair common Windows errors3Fix the driver behind crashes, sound loss and screen glitches1. Revenue growth and the quality of that growth
Track more than the year-over-year percentage
Quarterly revenue and year-over-year growth are the first checks, but they do not explain why sales changed. In each earnings release, separate growth into new customer wins, expanded commitments from existing customers, higher utilization of installed infrastructure and deployments that moved between periods. A quarter boosted by delayed installations can look strong while saying little about the next quarter’s run rate.
Build a simple bridge from the prior quarter: opening contracted work, new commitments, work delivered, cancellations or reductions, and closing backlog. Then compare recognized revenue with the amount of infrastructure that actually became available. If revenue rises while deployments repeatedly slip, execution—not demand—may be the binding constraint.
Measure revenue per active power unit
CoreWeave reports active power in gigawatts. Convert that into a consistent revenue-productivity measure, such as quarterly revenue divided by average active megawatts, using the same period and unit convention every quarter. Average beginning and ending active power when a mid-quarter deployment would otherwise distort the result. Rising revenue per active unit can indicate better utilization or a richer customer mix; a falling figure may signal underused capacity, ramp delays or pricing pressure.
Check the customer and contract mix
Ask whether growth is diversified across customers, applications and contract durations. A single large commitment can accelerate reported revenue and backlog while increasing cancellation or renegotiation risk. Look for disclosures about major customers, minimum commitments, take-or-pay provisions, renewal terms and the timing of service availability. The company identifies maintaining and growing its customer base, continued AI-infrastructure demand and strategic relationships as material risk areas; those disclosures belong beside the revenue chart, not in a separate footnote.
2. GAAP losses, adjusted EBITDA and the reconciliation
Start with GAAP operating and net results
GAAP operating income captures operating costs, including depreciation and amortization from data centers and computing equipment. GAAP net income or loss then incorporates financing and other non-operating items. For CoreWeave, the gap between operating and net results is especially important because net interest expense is large relative to operating profit. Net loss per share translates that burden into an equity-level measure, but it can change with share issuance and convertible instruments as well as with operations.
Use adjusted EBITDA as a bridge, not a verdict
Adjusted EBITDA excludes depreciation, interest, taxes and specified adjustments. It can help compare the economics of contracts before the cost of the asset base and capital structure, but it is not cash flow and does not pay debt by itself. Reconcile adjusted EBITDA to GAAP operating income every quarter. Identify depreciation, stock-based compensation, restructuring or other adjustments individually, and ask whether each is genuinely non-recurring.
The quarter’s adjusted EBITDA margin was 59%, while adjusted operating margin was 5% and GAAP operating income remained negative. That spread is a direct reminder that depreciation and other excluded costs are economically significant. A widening spread requires evidence that new capacity will generate enough incremental revenue to cover its eventual depreciation, maintenance and financing costs.
Follow margin direction and operating leverage
Record adjusted EBITDA margin, adjusted operating margin and GAAP operating margin in three separate columns. Improving adjusted EBITDA with flat or worsening GAAP margins may mean that asset intensity is rising faster than gross contribution. Conversely, a temporary GAAP decline during a rapid build-out may be acceptable if utilization, pricing and cash generation improve on a credible schedule. The test is the trend and the reconciliation, not management’s label for the quarter.
Free tools Windows power users keep installed
One-click scans. No signup required.
Rank #2
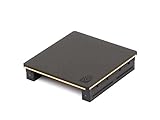
- Part number 900-53651-2500-000 and model: P3651
- This is the 2 slot version for when there is no empty slots between 2 slot cards. If you have one or more empty slots between the cards or the cards are 3 slot this NVLink will not work. See the attached images showing the card layout.
- NVLink 3.0 for any brand of RTX Ampere model graphics cards: 3090, A30, A40, A100 / H100 (Requires three NVLinks), A800, A4500, A5000, A5500, A6000
- This is the same as PNY part number: NVLAMP-2SLOT-BSP and RTXA6000NVLINK-KIT
- This is the same as Dell part number: 0RWJ7Y
3. Backlog: visibility that still has to convert
Understand what CoreWeave calls backlog
CoreWeave reported approximately $104 billion of revenue backlog at June 30, 2026, excluding more than $25 billion of net new commitments added early in the third quarter. The company describes backlog as remaining performance obligations and estimated future revenue under committed contracts, subject to delivery and service availability. It is therefore an indicator of potential revenue visibility, not recognized revenue, unrestricted cash or a guaranteed near-term result.
Calculate a conversion profile
For every update, compare backlog growth with revenue growth and create a time-phased conversion schedule if the company provides one. Useful measures include backlog divided by the latest-quarter annualized revenue, current-year expected revenue divided by opening backlog, and the portion expected to be delivered within 12 months. A rapidly rising backlog-to-revenue ratio can mean powerful demand, but it can also mean that capacity, power or data centers are not yet ready to serve contracts.
Test backlog against physical delivery
Pair each backlog update with active power, data-center openings, GPU deployments and customer go-live dates. New commitments that cannot be matched by available power and equipment are execution obligations rather than present earnings. Watch for changes in estimated service-availability dates, contract modifications, cancellations, customer concentration or language that makes delivery conditional.
4. Power, GPUs, capex and depreciation
Separate active from contracted capacity
Active power of 1.5 GW represents operating capacity; approximately 3.7 GW of contracted power includes future commitments. The difference is a pipeline that requires sites, grid access, equipment, financing and successful commissioning. Track the gap each quarter and the time required to turn contracted power into revenue-producing active power.
The Tool Desk
Outbyte PC Repair FREERepair Windows errors before they cause bigger problemsFix Now →Outbyte Driver Updater FREEFix the driver behind crashes, sound loss and screen glitchesFind Drivers →Relate capex to productive capacity
Capital expenditure is the cash cost of building or equipping data centers and purchasing computing hardware. Compare capex with the additional active megawatts and GPUs brought online, then compare those additions with incremental revenue. A useful internal worksheet has four columns: capex spent, power commissioned, computing capacity deployed and revenue generated after a defined ramp period.
Do not treat a lower quarterly capex figure as automatically positive. It may reflect a pause in expansion, timing of supplier payments or a capacity bottleneck. Likewise, high capex can be rational during a profitable expansion if utilization and returns improve. The decision point is whether each investment cohort produces adequate revenue and operating cash over its useful life.
Watch depreciation and hardware productivity
Depreciation and amortization reached $2.540 billion in the first six months of 2026. Compare that charge with revenue and with the age and utilization of deployed GPUs. If depreciation rises faster than revenue per active unit, the company may be adding assets faster than it can monetize them, or the useful-life assumptions may become more consequential. Ask whether newer hardware displaces older equipment, whether residual values are realistic and whether customers are paying enough to cover the complete asset cycle.
Rank #3
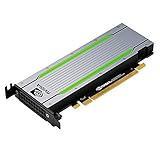
- Video/Sound Cards
- Passive Cooling
5. Debt, liquidity and interest coverage
Measure the financing burden directly
Net interest expense was $640 million in the second quarter and $1.176 billion in the first six months. Calculate interest coverage using both GAAP operating income and adjusted EBITDA, clearly labeling each version. Coverage based only on adjusted EBITDA can look comfortable while GAAP operating earnings remain insufficient to service interest after depreciation.
Map maturities and refinancing exposure
CoreWeave highlighted a $3.1 billion delayed-draw term loan and more than $10 billion of unsecured debt and convertible bonds in its quarter’s financial-position update. Maintain a maturity ladder showing principal due, coupon or floating-rate exposure, drawn versus undrawn commitments, security, covenants and the next refinancing decision. Rising benchmark rates, wider credit spreads or weaker equity prices can make refinancing more expensive even when revenue is growing.
Check liquidity and covenant headroom
Review cash, restricted cash, undrawn facilities, operating cash flow, committed capex and minimum-liquidity covenants together. A large cash balance can be temporary if suppliers, construction partners or lenders are due to be paid soon. Look for collateral requirements, borrowing-base limits, change-of-control clauses and any warning that additional capital may be needed. The company’s stated risks include capital requirements and its ability to raise additional capital, so liquidity should be monitored every quarter rather than annually.
6. Cash-flow reality: the EBITDA-to-cash bridge
Use six-month figures to reduce quarterly noise
For the first six months of 2026, CoreWeave reported revenue of $4.653 billion, a net loss of $1.366 billion, net interest expense of $1.176 billion, depreciation and amortization of $2.540 billion, and adjusted EBITDA of $2.667 billion at a 57% margin. The six-month view makes the scale of the EBITDA-to-cash gap visible without relying on one quarter’s deployment timing.
Build a free-cash-flow waterfall
- Start with net income or loss.
- Add back non-cash depreciation, amortization and stock-based compensation, identifying each separately.
- Include working-capital movements, especially receivables, payables, customer deposits and construction-related balances.
- Subtract cash interest and cash taxes.
- Subtract purchases of property, equipment and GPUs.
- Separate maintenance capex from expansion capex when management provides the split.
The resulting figure is the cash available to repay debt, fund additional construction or return capital. Adjusted EBITDA should not be substituted for this waterfall. Sustained negative free cash flow despite strong EBITDA can be acceptable during a high-return build-out, but it increases dependence on debt and equity markets.
Recommended Free Tools
7. Customer concentration and execution risk
Monitor concentration as a percentage, not just a name
Track the share of revenue and backlog represented by the largest customer or customer group, together with contract expiry and renewal dates. Concentration can magnify the effect of a delayed deployment, service outage, pricing renegotiation or cancellation. A growing total backlog does not eliminate this risk if most of the increase comes from one counterparty.
Use operational milestones as leading indicators
Follow power interconnection dates, data-center construction, equipment delivery, uptime, service availability and customer acceptance. Delays can defer revenue while interest and depreciation begin before a site earns its intended return. Also monitor internal-control disclosures and any disruption involving suppliers, data-center partners or strategic relationships.
Rank #4

- CUDA Cores: 4608 / NVIDIA Tensor Cores: 576 / NVIDIA RT Cores: 72
- GPU Memory: 24 GB GDDR6 with ECC / Bandwidth: 624 GB/Sec
- System Interface: PCI Express 3.0 x16
- Four DisplayPort 1.4 Connectors
- 3D Stereo Support with Stereo Connector
Define thesis-breakers in advance
Before buying or holding the stock, write down the evidence that would change your view: backlog failing to convert on schedule; repeated power or facility delays; customer cancellations; materially higher interest costs; inability to refinance; GPU depreciation outpacing revenue productivity; or persistent negative cash flow after capex. Predefined tests reduce the temptation to explain away every disappointing quarter.
A practical quarterly monitoring checklist
Update this scorecard after each earnings release and compare the newest column with the prior four quarters.
| Area | Questions to answer | Warning signal |
|---|---|---|
| Revenue | How much came from new customers, expansions and utilization? | Growth depends on delayed or one-time deployments |
| Profitability | What changed GAAP margins, adjusted margins and the reconciliation? | EBITDA rises while operating margin deteriorates |
| Backlog | What portion is deliverable within 12 months, and who holds it? | Backlog grows faster than physical capacity or conversion |
| Capacity | How much power and GPU capacity became active? | Contracted power expands without commissioning progress |
| Capital intensity | What capex and depreciation support each revenue dollar? | Depreciation or capex rises faster than productivity |
| Debt | What maturities, rates and covenants changed? | Interest coverage shrinks or refinancing moves closer |
| Cash flow | What remains after interest, working capital and capex? | Strong EBITDA but recurring cash burn |
| Guidance | Did targets change, and did actual results meet the prior guide? | Repeated revisions or unexplained timing shifts |
Management characterized the quarter as an inflection point in operating leverage. That is a management view, not an independently established conclusion. The appropriate test is whether subsequent quarters show improving GAAP operating performance, reliable backlog conversion, productive new capacity and less dependence on external financing.
How to interpret the next earnings update
Constructive pattern
A constructive update would show revenue growing with diversified customers, backlog converting on schedule, active power increasing in line with commitments, stable or improving revenue per active unit, and adjusted EBITDA translating into operating cash after interest and capex. Debt maturities would remain manageable, and guidance would be met without repeated timing explanations.
High-growth but high-risk pattern
Revenue and backlog could continue climbing while contracted power greatly exceeds active power, capex remains elevated, depreciation accelerates and free cash flow stays negative. That profile may offer substantial upside if deployment succeeds, but its equity risk is tied to financing access and execution as much as to demand.
Thesis-break pattern
A thesis is under pressure when commitments are cancelled or delayed, customer concentration increases, service availability slips, interest costs rise, refinancing becomes more expensive or revenue productivity falls as new GPUs are added. In that case, a high adjusted EBITDA margin should not be used alone to dismiss the deterioration.
Crashes, No Sound, or Screen Glitches?
Random freezes, missing sound and display glitches usually trace back to one bad driver. Find and replace yours safely.Free scan · under a minutePC Slower Than It Used to Be?
A free scan shows the junk files, broken settings and background clutter dragging Windows down - then fixes them in one click.Free scan · Windows 10 & 11What these metrics cannot tell you by themselves
These operating and financial measures do not establish a fair share price or valuation multiple. The available company data cited here includes no independent analyst consensus, live stock price, third-party forecast or price target. Investors seeking a valuation decision must add the current share count, dilution from convertibles and equity awards, net debt, expected cash generation and scenario-based assumptions, while keeping those estimates separate from reported results.
Quick Recap
Product prices and availability are accurate as of the date/time indicated and are subject to change. Any price and availability information displayed on Amazon at the time of purchase will apply.




